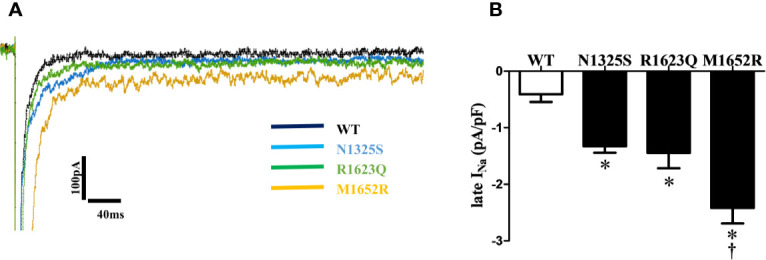
Figure 3.

N1325S, R1623Q, and M1652R mutations increased late I Na. (A) Representative traces of late I Na in WT, N1325S, R1623Q and M1652R mutant channels. (B) Bar graph summarized late I Na at 200 ms, and showed that all three mutations increased late I Na but with the greatest amplitude of late I Na in the M1652R channel. Late INa was measured at 200 ms after a voltage step from -90 to -20 mV. *P < 0.05, compared with WT; † P < 0.05, M1652R value versus N1325S and R1623Q.
