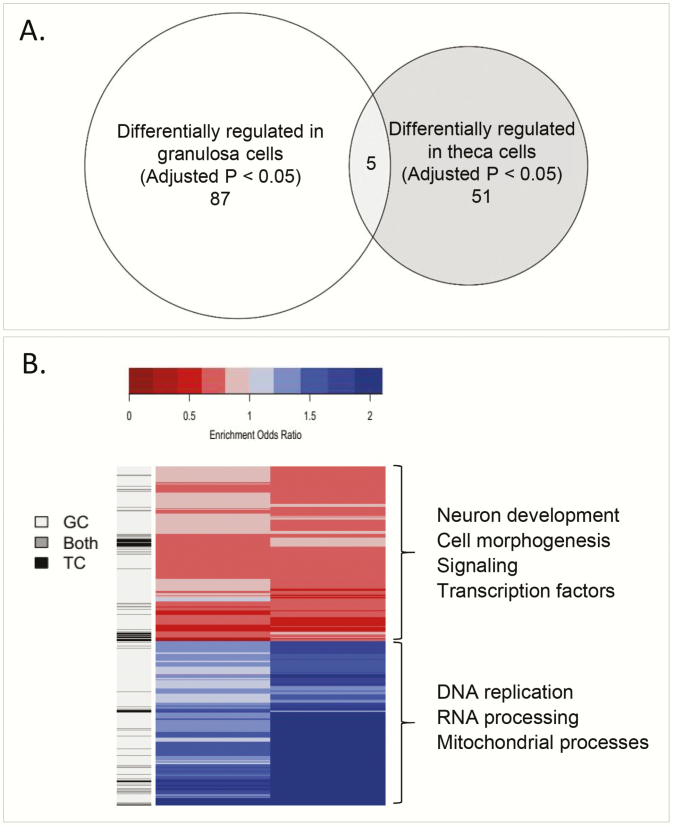
Figure 4.
A, Venn diagram of genes in common between granulosa and theca cells at an adjusted P less than .05 level (BCORL1, EXOSC9, TGFBR1, BCL9L, MKNK2). B, Heat map of pathways with a false discovery rate of less than .01 in either granulosa or theca. (1079 pathways, 140 both, 55 theca cells only, 884 granulosa cells only), with some key pathways highlighted in either or both cell types.

