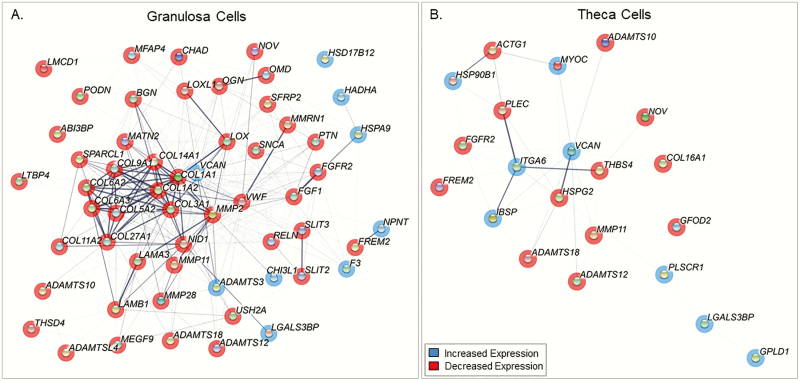
Figure 7.
Network diagram of gene interactions of genes involved in extracellular matrix in A, granulosa and B, theca cells from prenatal testosterone (T)-treated sheep. Minimum interaction score of 0.3. Genes with P less than .05 are shown as nodes. Genes in red are downregulated and blue are upregulated, and pink are both. Thickness of connection between nodes represent the level of evidence for interactions.

