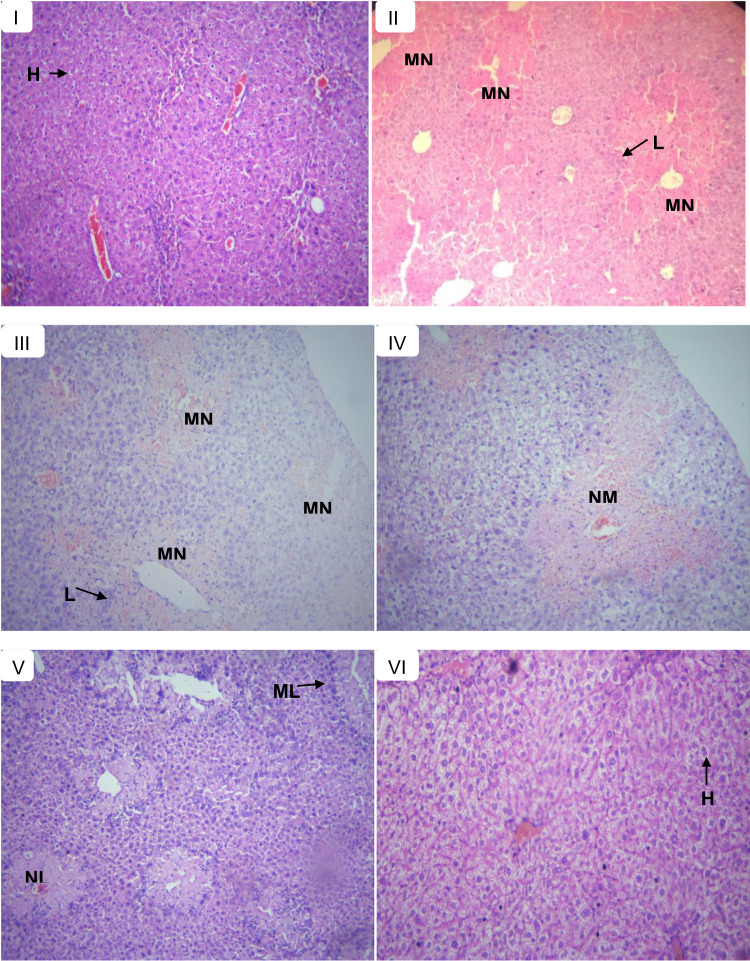
Figure 3.
Histopathological section of liver tissues in control and experimental groups of mice in the pre-treatment model; showing normal hepatic cells (H), lymphocytic infiltrates (L), multifocal necrosis (MN), moderate necrosis (NM), mild lymphocytic infiltrates (ML), and mild necrosis (NL). (A) Normal control received with distilled water, (B) toxic control received CCl4, (C) treated with 125 mg/kg extract, (D) treated with 250 mg/kg extract, (E) treated with 500 mg/kg extract, and (F) treated with silymarin 100 mg/kg.

