
Figure 1. Relative Glucose Metabolism and Gray Matter Volume in Presymptomatic Carriers of a Hexanucleotide Repeat Expansion in the C9orf72 Gene (PreSxC9) Corrected for Age on Axial, Coronal, and Sagittal Sections .
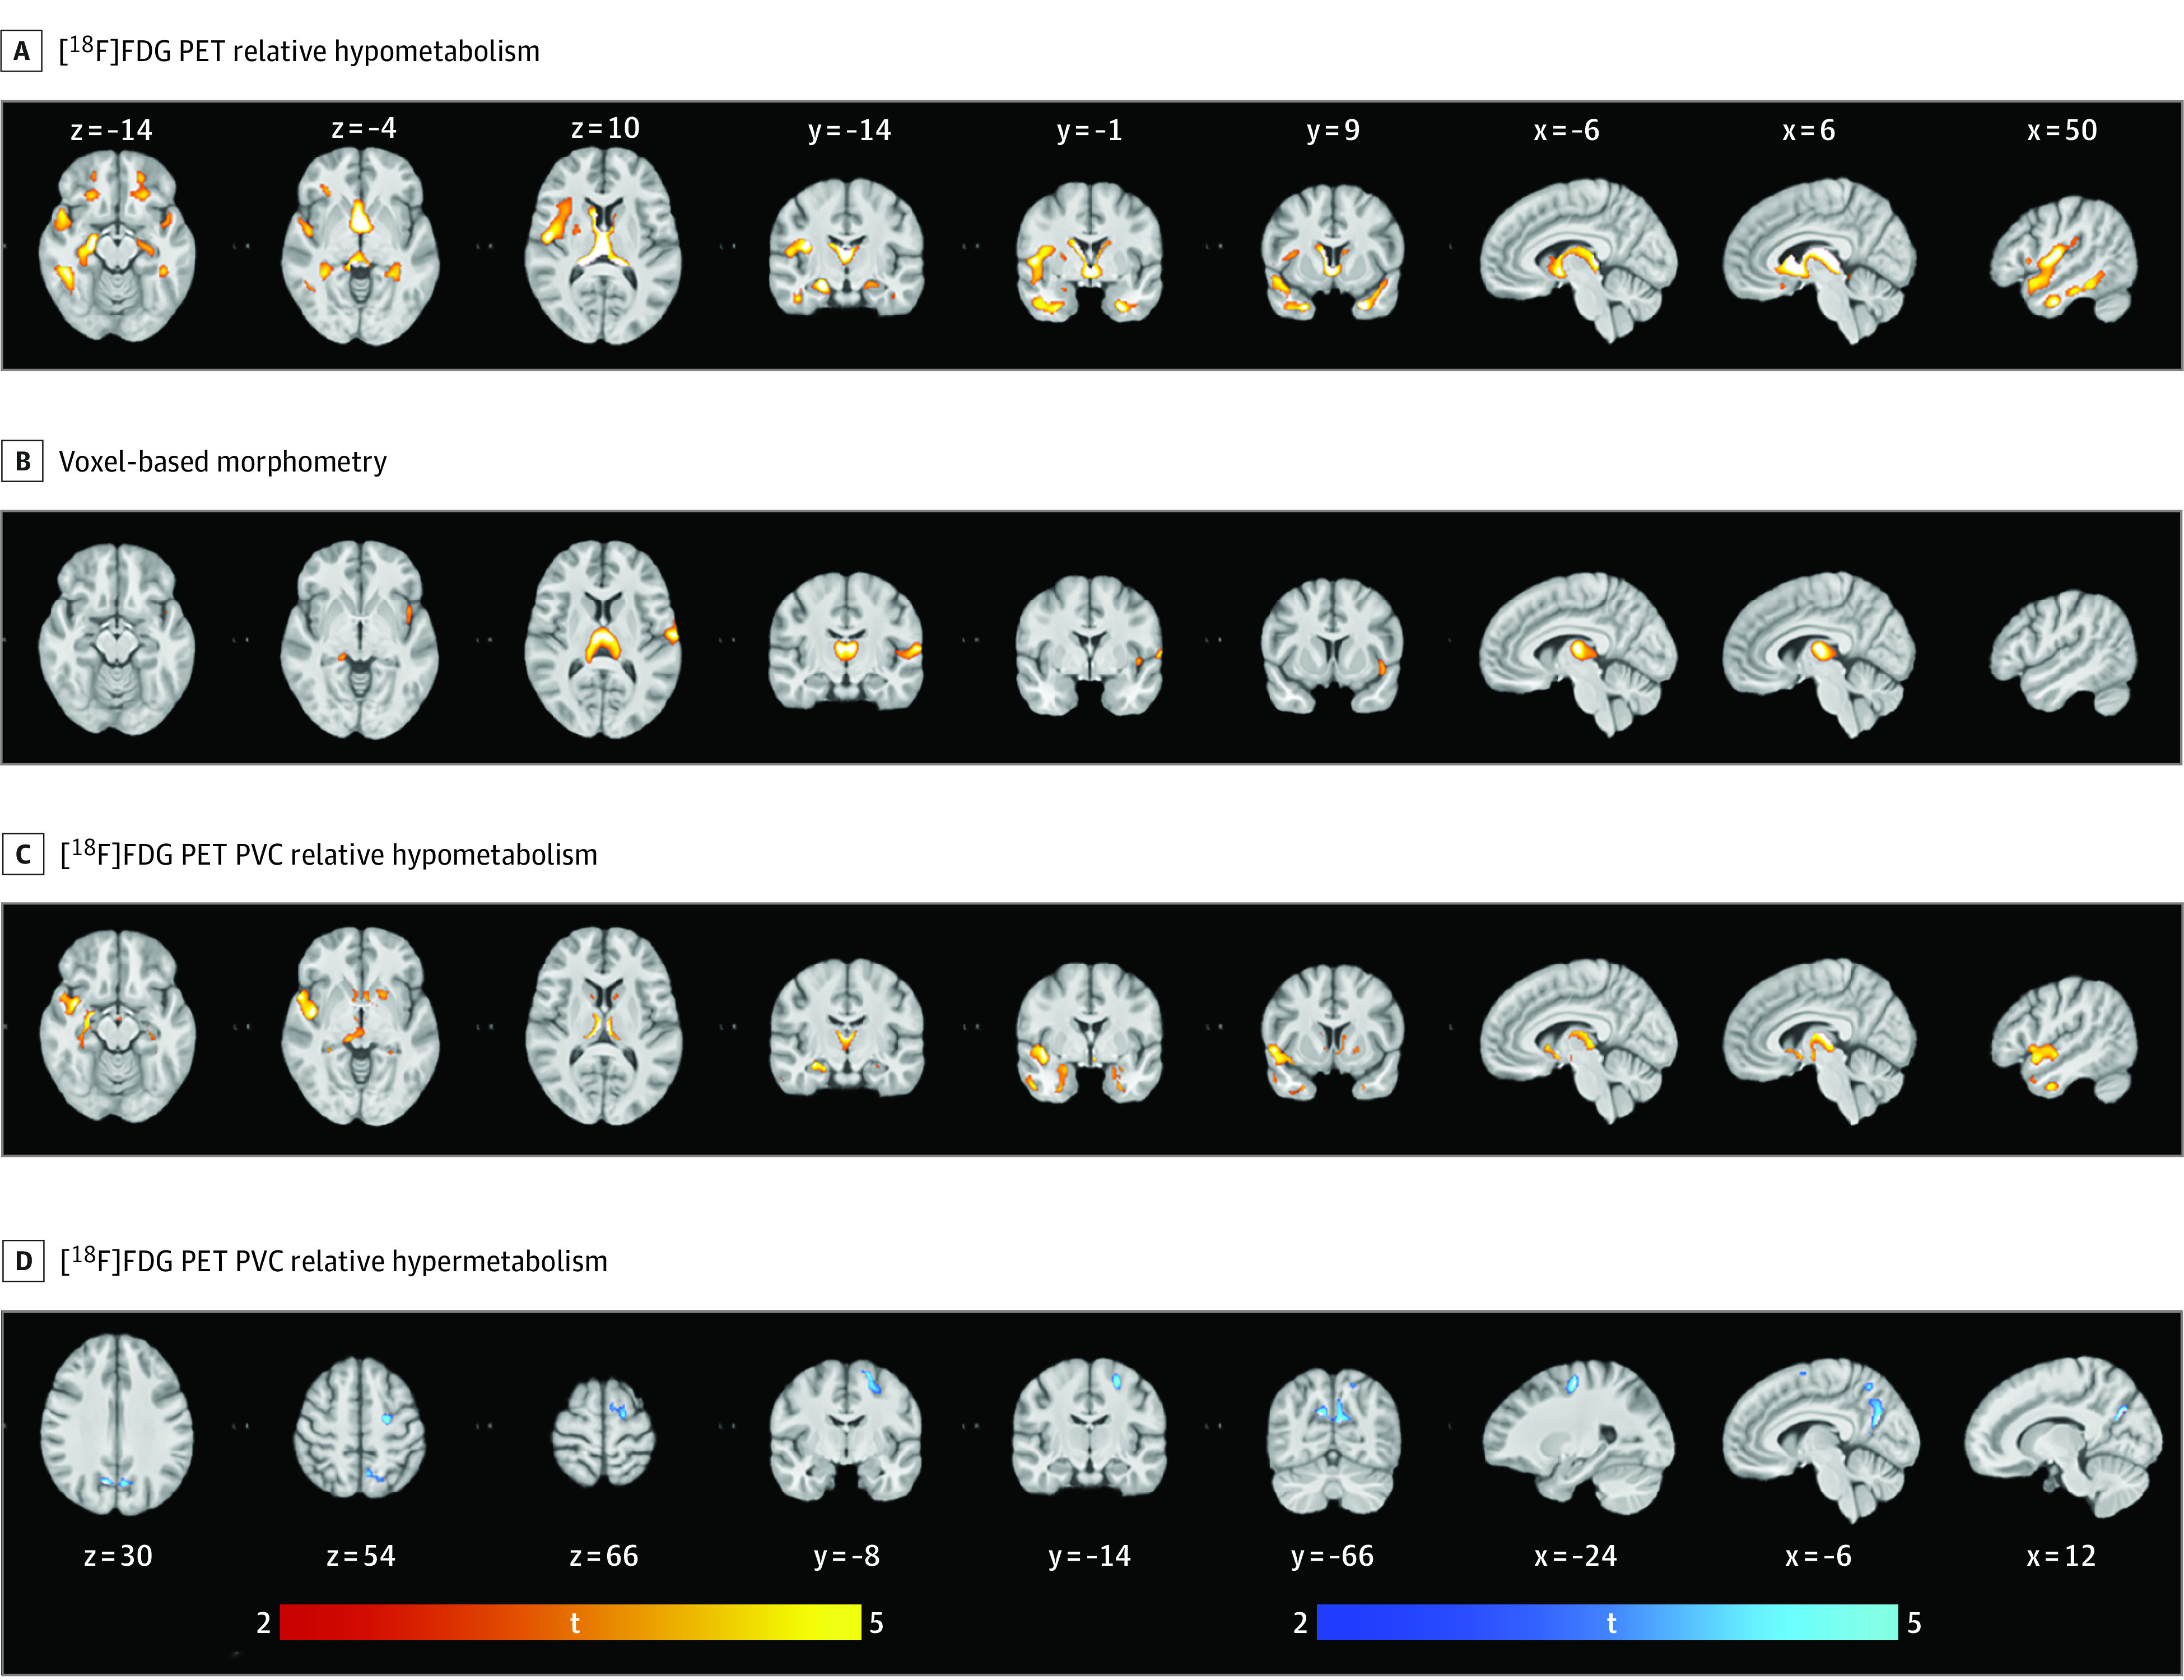
Reduced glucose metabolism and gray matter volume depicted in red-yellow, and increased glucose metabolism depicted in blue-white. Data were analyzed at a height threshold of P < .001 and were cluster level corrected for familywise error at P < .05. A, Projections of areas with relative hypometabolism in preSxC9 participants vs healthy controls. B, Volume decline in preSxC9 participants vs healthy controls. C, Relative hypometabolism in preSxC9 participants and healthy controls following voxel-based PVC. D, Relative hypermetabolism in preSxC9 and healthy controls following voxel-based PVC. [18F]FDG indicates fluorine 18–labeled fluorodeoxyglucose; PET, positron emission tomography; PVC, partial volume correction; and t, t value. Section numbers refer to Montreal Neurological Institute coordinates.