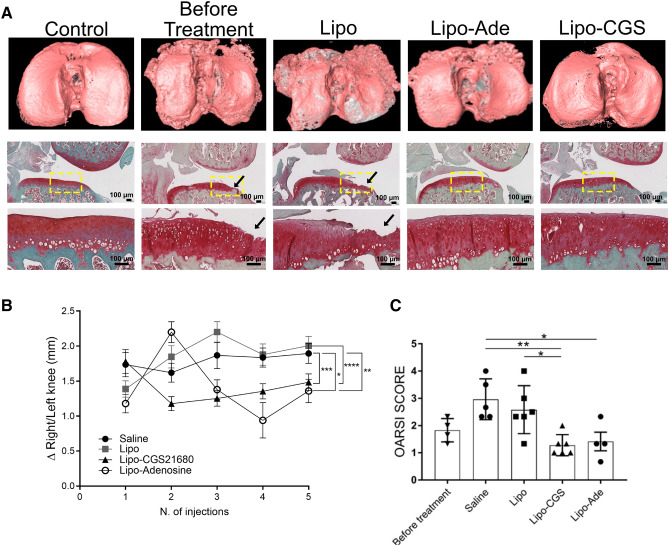
Figure 2.
Adenosine and A2AR stimulation promote cartilage formation in an established PTOA model. A. On the top raw representative mCT images of hexabrix-imaged tibia. The cartilage is pink in this image and underlying bone is dark gray. In the row beneath are representative safranin-O-stained sections (the yellow square define the magnified area on the raw below; black arrow are pointing at the region of cartilage damage). Figures labeled “Before Treatment” are of rat knees collected 4 weeks after disruption of ACL when intraarticular injections would have commenced in the various treatment groups. B. Swelling measurement of the knee joint before every injection compare to the healthy knee of each rat for the different experimental group. C. Graphs show the OARSI scores of the knees of the rats studied here. Data are expressed as mean ± S.E.M. of 4–6 animals for each group and data were analyzed for statistical significance by one-way analysis of variance followed by Bonferroni post hoc test of differences among various treatments (*p < 0.05; **p < 0.01; ***p < 0.001; ****p < 0.0001).

