
FIGURE 3.
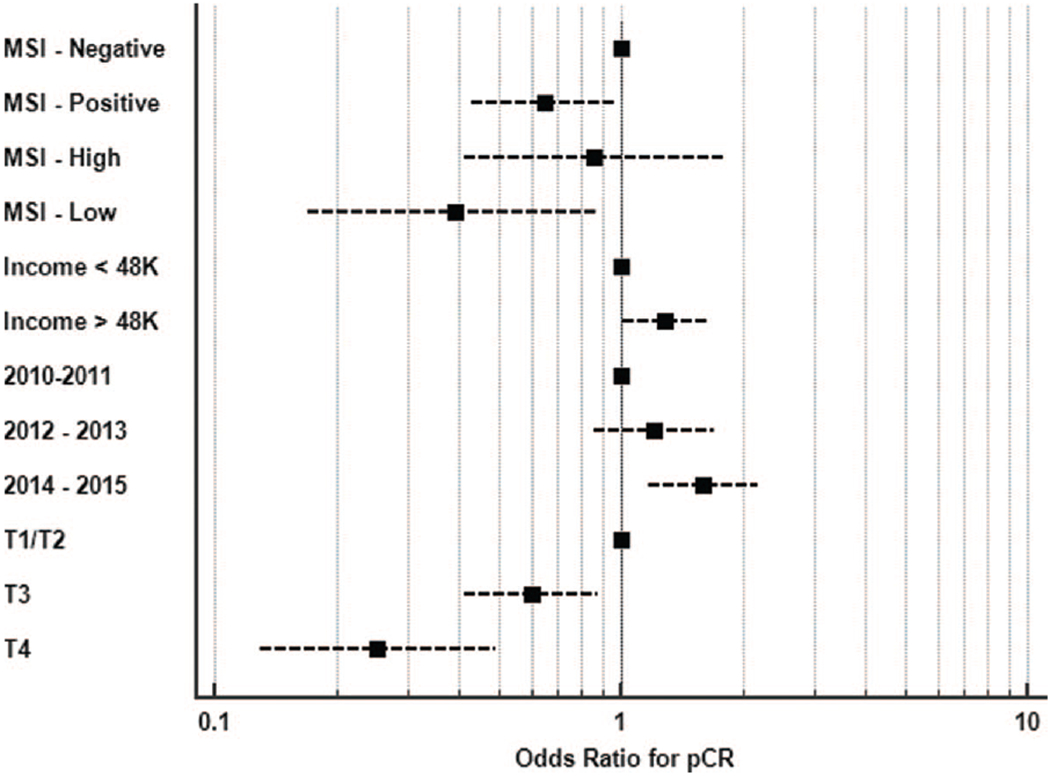
Forest plot with odds ratios for pCR based on multivariable regression analysis. Note: MSI-high/MSI-low testing conducted independently of MSI-negative/MSI-positive to avoid confounding covariability.
Official websites use .gov
A
.gov website belongs to an official
government organization in the United States.
Secure .gov websites use HTTPS
A lock (
) or https:// means you've safely
connected to the .gov website. Share sensitive
information only on official, secure websites.
Forest plot with odds ratios for pCR based on multivariable regression analysis. Note: MSI-high/MSI-low testing conducted independently of MSI-negative/MSI-positive to avoid confounding covariability.