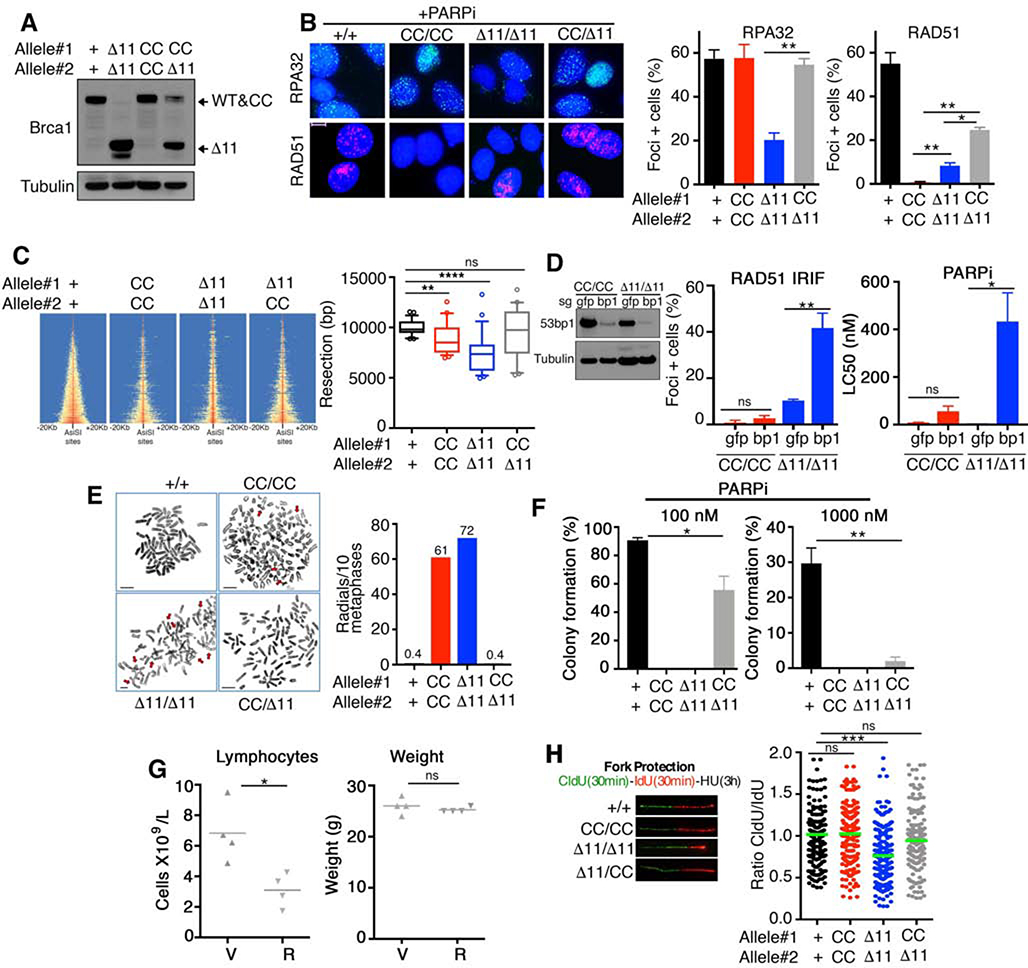
Fig. 3. Brca1 alleles confer distinct functional deficiencies.
(A) MEFs were assessed for Brca1 protein expression by Western blotting. Predicted isoform migration patterns are indicated. (B) RPA32 and RAD51 foci formation was measured by IF after treatment with 1 μM rucaparib for 24 hours. For each protein, a minimum of 100 nuclei per cell line were counted per experiment. Mean and S.E.M. percentages of cells containing 5 or more foci are shown (n=3). Representative foci images are inset, scale bar 10 μm. (C) Heatmap of END-seq signals across individual AsiSI sites in the indicated MEFs measured 5 h after AsiSI induction. (Right), boxplots showing the quantification of resection endpoints in the top 10% resected breaks in the indicated MEFs at AsiSI-cleaved DSB sites. Welch’s t test was used to determine statistical significance. (D) MEFs were subject to CRISPR/Cas9 and sgRNA targeting gfp or 53bp1 (bp1). Cells were subsequently assessed for RAD51 IRIF as described in Fig.1C (left), or treated with the PARPi rucaparib and colony formation assays performed (right), mean and S.D. are shown (n=3), inset western blotting showing 53bp1 (bp1) protein levels. (E) Metaphase spreads were prepared from the indicated genotypes of MEFs treated with 500 nM rucaparib for 24 hours. The mean number of radial chromosomes per 10 metaphases are shown. The number of metaphases assessed were 30 for Brca1+/+, 26 for Brca1CC/CC; 25 for Brca1Δ11/Δ11, and 25 for Brca1CC/Δ11 MEFs. Scale bars, 10 μm. Red arrows point to aberrations. (F) MEFs were treated with 100 nM (left) or 1000 nM (right) rucaparib for 2 weeks and assessed for colony formation. Mean and S.D. colony formation is shown as a percentage of DMSO treated cells, n = 3. (G) Brca1CC/Δ11 mice 5–6 weeks old were treated with vehicle (V) or 200 mg/kg rucaparib (R) bi-daily for 5 days and peripheral blood collected 2 days after the last dose. Blood was assessed for lymphocyte cell numbers (left) and mice measured for body weight (right). (H) MEFs were sequentially pulsed with 50 μM CldU for 30 min, 250 μM IdU for 30 min, and 2 mM hydroxyurea for 3h. DNA fiber tract lengths and are presented as CldU/ IdU length ratio. Inset, representative fibers. *p < 0.05 **p < 0.01, *** p < 0.001, ns p > 0.05 (unpaired t-test).

