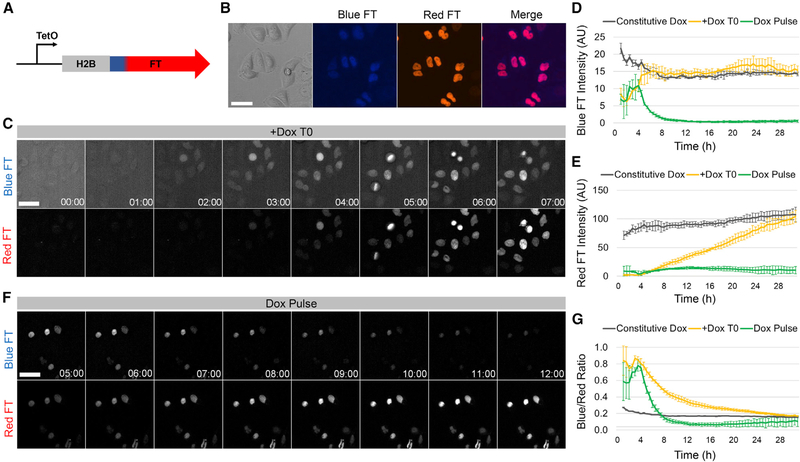
Figure 2. Characterization of the H2B-FT Reporter in Cultured Cells.
(A) The inducible H2B-FT expression construct.
(B) HeLa cells expressing H2B-FT.
(C) Time series of H2B-FT fluorescence in HeLa cells after Dox induction.
(D and E) Quantification of average nuclear blue (D) and red (E) FT intensity over time following Dox treatment.
(F) Time series of HeLa cells after Dox washout at T = 4.5 h.
(G) BR over time following Dox treatment. Error bars represent SD across n = 3 culture wells. Scale bars, 50 μm.

