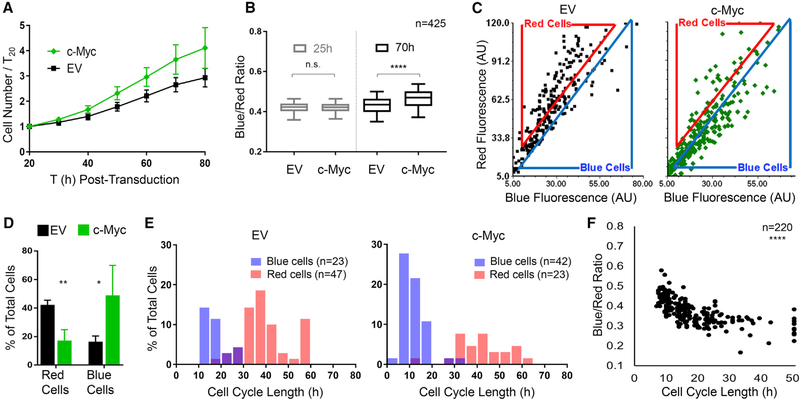
Figure 3. H2B-FT Color Profile Reflects Cell Proliferation Rate In Vitro.
(A) Proliferation of H2B-FT MEFs after transduction with c-Myc or empty vector control (EV). Error bars: SD across n = 4 culture wells.
(B) Cellular BR at 25 and 70 h post-transduction. Box plots represent median and interquartile range (IQR); whiskers, 5th–95th percentiles. p = 0.295 (25 h) and p < 0.0001 (70 h) on the basis of Mann-Whitney test with 99% confidence interval (CI).
(C) Representative blue versus red intensity of individual cells at 70 h post transduction. Flow cytometry-style gates define “red” and “blue” populations (see also Figures S3A and S3B).
(D) Percentage of cells within gates defined in (C). Percentages do not total 100%, as many cells lie between red and blue gates. Error bars show SD across n = 4 culture wells. p = 0.0035 (red cells) and p = 0.0498 (blue cells) on the basis of Student’s t test with Welch’s correction, 95% CI. dF = 4.057 (red cells) and dF = 3.221 (blue cells).
(E) Cell cycle length distributions in each gate as measured by image-based tracking. Cell cycle length refers to the time interval between consecutive mitoses.
(F) Correlation between cell cycle length and BR. All trackable cells (n = 220) from c-Myc and EV conditions are plotted. Spearman correlation coefficient = 0.7648; p < 0.0001 with 95% CI.
n values in (B) and (E) refer to the numbers of single cells analyzed.

