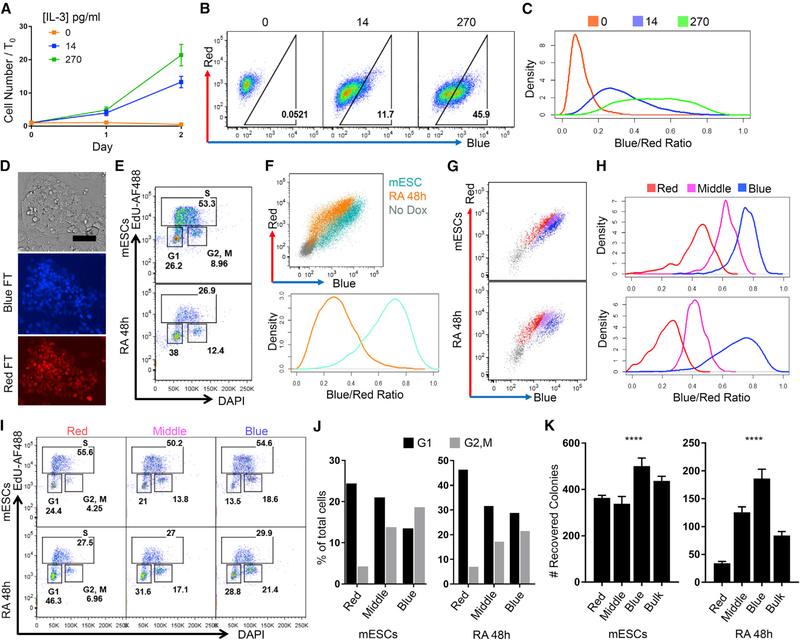
Figure 4. H2B-FT Enables Fluorescence-Activated Cell Sorting of Live Cells with Different Proliferative Rates.
(A) BaF3 proliferation in varying IL-3 concentrations. Error bars: SD across n = 6 culture wells.
(B) Representative flow cytometry plots of BaF3 cells expressing H2B-FT-medium, grown as in (A).
(C) Density plots of BR derived from flow cytometry data in (B).
(D) H2B-FT knockin mESCs. Scale bar, 80 μm. Full-size image shown in Data S3A.
(E) DAPI/EdU cell cycle profile after 48 h RA treatment.
(F) Representative flow cytometry plots of pluripotent and RA-treated mESCs (top). Cells not exposed to Dox served as colorless control to demarcate H2B-FT+ gate. Data were rendered into BR density plots (bottom).
(G and H) Pluripotent and RA-treated mESCs stably expressing H2B-FT via Sleeping Beauty transposon were sorted on the basis of BR using the gating strategy shown. Non-transfected mESCs (gray) served as colorless control. (G) Representative FACS plots and gating. (H) Quantification of BR.
(I) DAPI/EdU cell cycle profiles of sub-populations sorted as in (G).
(J) Percentage of cells in G1 versus G2/M from the sorted populations in (G).
(K) Number of AP+ colonies recovered per 8,000 cells sorted in (G) after 6 day culture. Error bars: SD across n = 3 or 4 culture wells. p < 0.001, one-way ANOVA, dF = 3.
See also Figures S3D, S3E, and S4.

