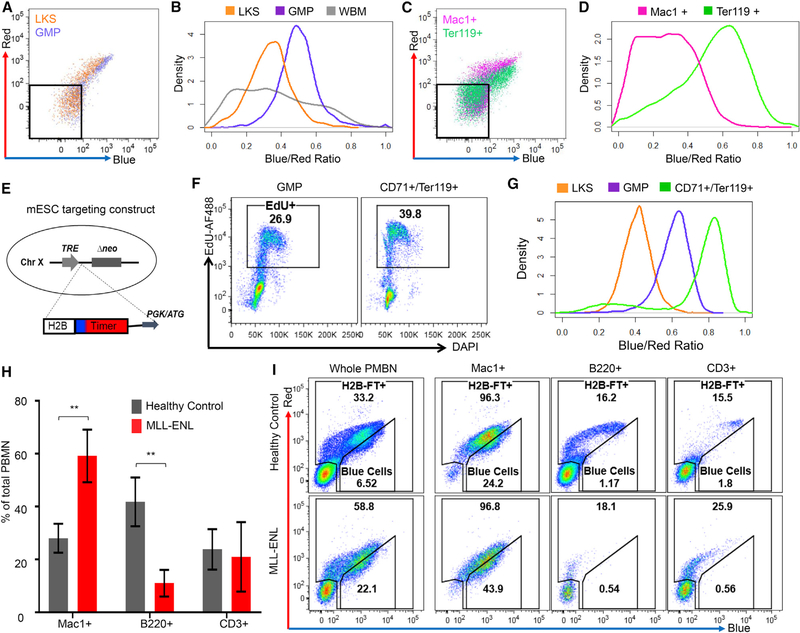
Figure 5. The Proliferative Landscape of Live Hematopoietic Cells as Captured by the H2B-FT Reporter.
(A) Representative flow cytometry plots of LKS and GMP cells from mouse BM reconstituted by HSPCs virally expressing H2B-FT.
(B) Data from (A) plotted as BR distribution, with WBM BR added.
(C) Flow cytometry plots of myeloid (Mac1+) and erythroid (Ter119+) cells from the mouse in (A) and (B).
(D) BR distribution of data in (C). Gates in (A) and (C) excluded the non-transduced (H2B-FT−) cells.
(E) Targeting strategy for the iH2B-FT mouse allele.
(F) DAPI/EdU profiles of GMPs versus early erythroid cells after 2 h EdU labeling in vivo.
(G) BR distributions in LKS, GMPs, and early erythroid cells.
(H) Percentage of myeloid (Mac1+), B cell (B220+), and T cell (CD3+) cells in peripheral blood of healthy iH2B-FT mice versus those crossed with MLL-ENL (n = 3 mice per group). All mice were treated with Dox ≥8 days prior to analysis. Error bars represent SD; p = 0.0090 (Mac1+), p = 0.0072 (B220+), and p = 0.7629 (CD3+) on the basis of Student’s t test with 95% CI, dF = 4.
(I) Representative BR profiles of the PBMN subsets in (H).

