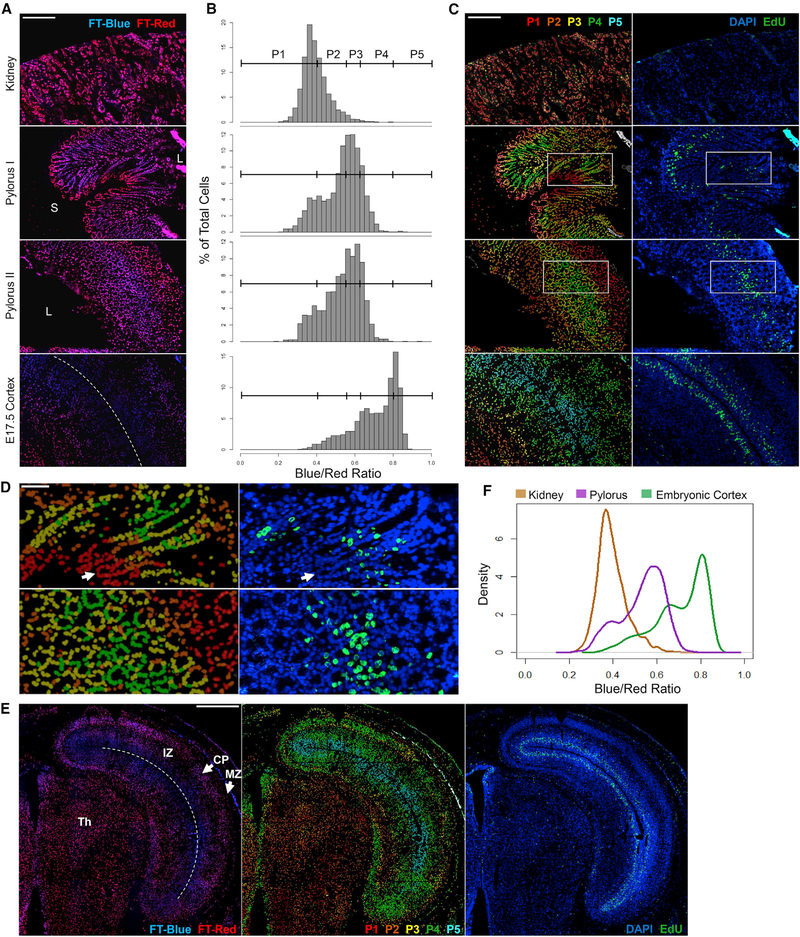
Figure 6. H2B-FT Profile Is Consistent with Relative Turnover Rates in Solid Tissue Sections.
(A) H2B-FT appearance in representative frozen sections from adult and embryonic iH2B-FT mice. Top: kidney. Middle: gastric glands in two orientations, longitudinal (pylorus I) and oblique/cross-sectional (pylorus II). L, lumen; S, submucosa. Bottom: neocortex of an E17.5 embryo. Dotted line indicates lateral ventricle (LV). See Figure S6 for single-channel images.
(B) BR histogram for each image in (A) was subdivided into five populations of increasing BR (P1–P5).
(C) Left, a heatmap corresponding to P1–P5 in (B) projected onto images from (A). Right: the same regions after DAPI/EdU labeling.
(D) Zoomed-in view of pyloric regions boxed in (C). Arrow: base of a gastric gland.
(E) Tiled images of an E17.5 embryonic brain hemisphere. Left: H2B-FT. Middle: heatmap of BR binned as in (B). Right: same region after DAPI/EdU labeling. Dotted line indicates LV. IZ, intermediate zone; CP, cortical plate; MZ, marginal zone; Th, thalamus.
(F) BR distributions from all tissues in (A). “Pylorus” includes combined data from both orientations (pylorus I and II, A).
Scale bars, 200 μm (A and C), 80 μm (D), and 500 μm (E). Full-size images are shown in Data S3B–S3H.

