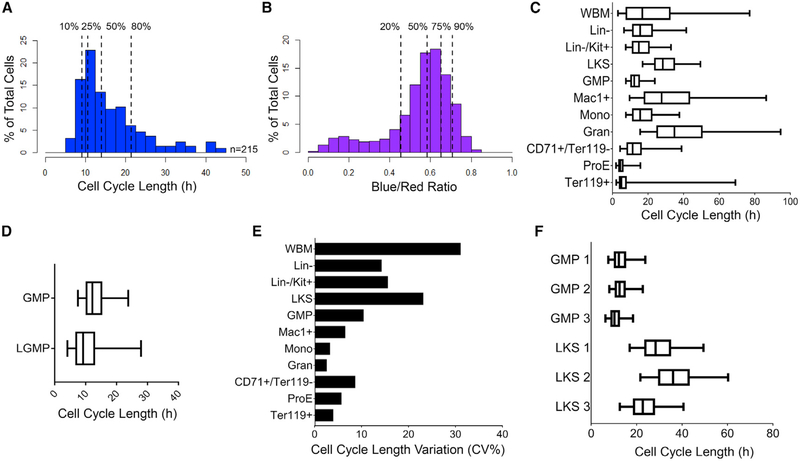
Figure 7. Estimating In Vivo Cell Cycle Length from H2B-FT BR.
(A and B) Cell cycle length distribution of n = 215 GMPs determined by time-lapse microscopy and BR distribution as analyzed by flow cytometry. Dotted lines show indicated percentiles.
(C) Calculated cell cycle length distributions of BM populations from a representative iH2B-FT mouse.
(D) Cell cycle length distribution of L-GMPs driven by MLL-ENL versus normal GMPs.
(E) Median cell cycle length variation among n = 3 iH2B-FT mice, shown by percentage coefficient of variation (CV%).
(F) Cell cycle length distributions of LKS and GMP from the individual mice in (E).
Boxes in (C), (D), and (F) represent median and IQR of each group; whiskers, 5th–95th percentiles. See also Figure S7.

