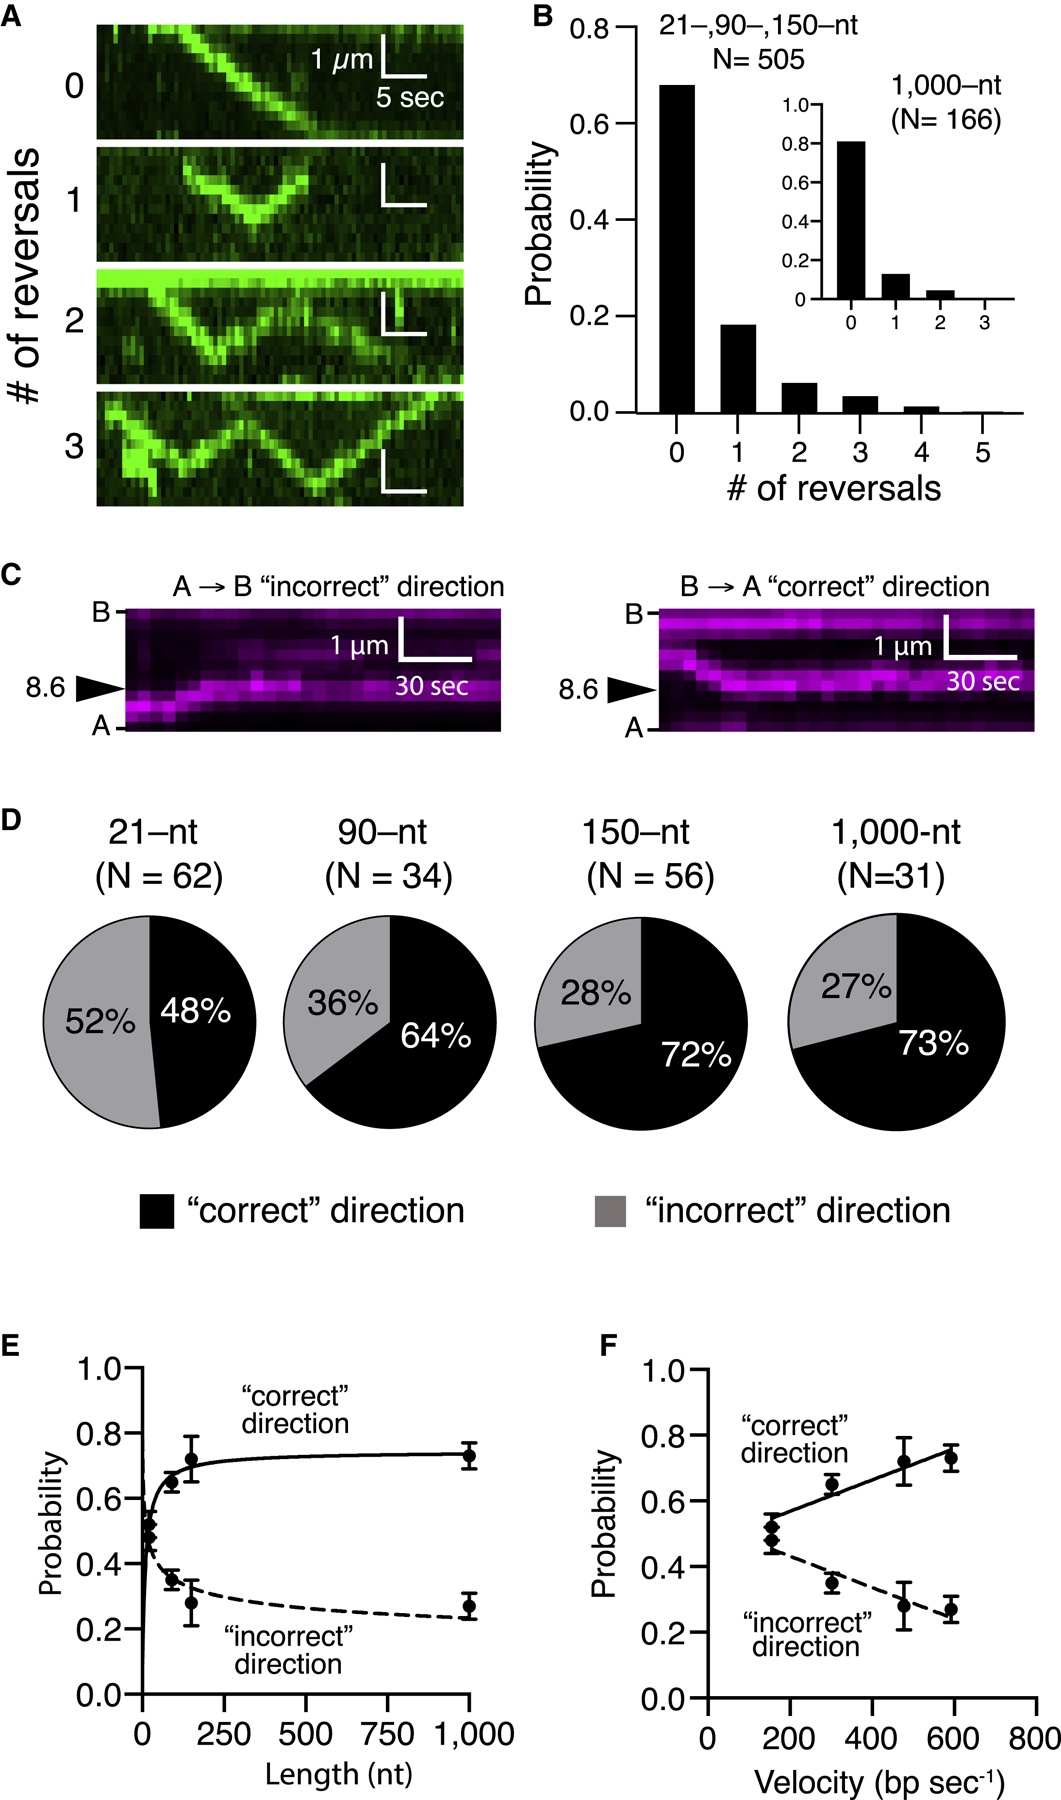
Figure 3. Homology Recognition and Translocation Direction.

(A) Kymographs illustrating examples of varying numbers of reversal events by the PSC (unlabeled Rad51, GFP-Rad54 [green], and unlabeled 150-nt ssDNA).
(B) Frequency of observed translocation reversalevents; the main panel corresponds to pooled datasets for the tailed duplex (21-nt ssDNA), 90 nt and 150 nt, which were all similar in reversal characteristics, and the inset corresponds to the 1,000-nt ssDNA substrate.
(C) Kymographs illustrating examples of homologoustarget recognition for translocation events occurring in either direction. B, barrier; A, anchor (Figure 1A; unlabeled Rad51, unlabeled Rad54, and Atto565-DNA [magenta]).
(D) Relative fraction of first-passage recognition events occurring for PSC translocation in either direction for different-length PSC substrates.
(E and F) Relative fraction of first-passage recognition events for either direction as a function of (E) PSC ssDNA length or (F) translocation velocity. The error bars represent the SD for three independent experiments. (E) and (F) represent different presentations and analyses of the same experimental dataset.
