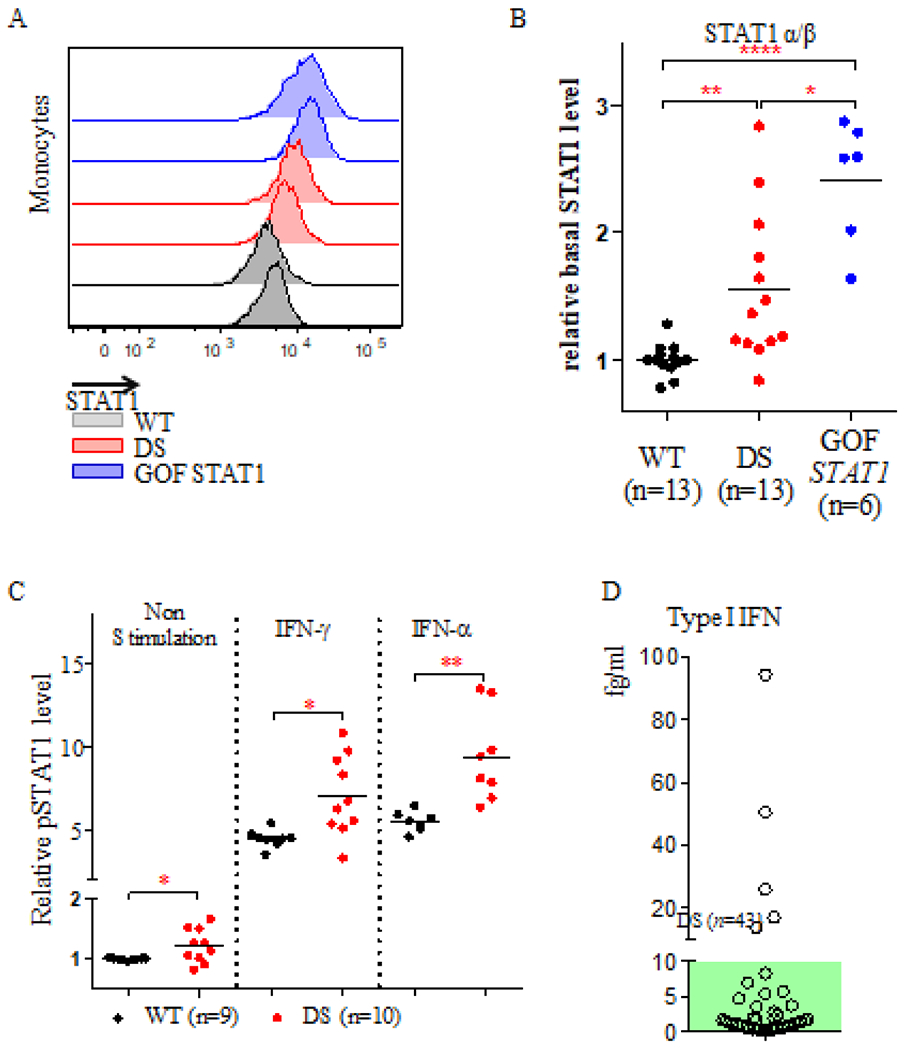
Figure 5: Total STAT1 and pSTAT1 levels in monocytes and plasma type I interferon levels in DS patients.

(A). Representative histogram of total STAT1 α/β protein levels in monocytes from two healthy controls (gray), two DS patients (red) and two patients with GOF STAT1 mutations (blue). (B). Relative levels of total STAT1 α/β protein in 13 healthy controls, 13 DS patients, and 6 patients with GOF STAT1 mutations. (C). Relative pSTAT1 levels in monocytes from 9 healthy controls and 10 DS patients, with and without IFN stimulation. Difference between the two groups were assessed in t tests. * p≤ 0.05; ** p≤0.005; **** p≤ 0.0001. (D). Plasma IFN-α protein levels were quantified in 43 DS patients with a single molecular array (Sigmoa). The green area indicates the normal range of IFN-α levels (≤ 10 fg/ml).
