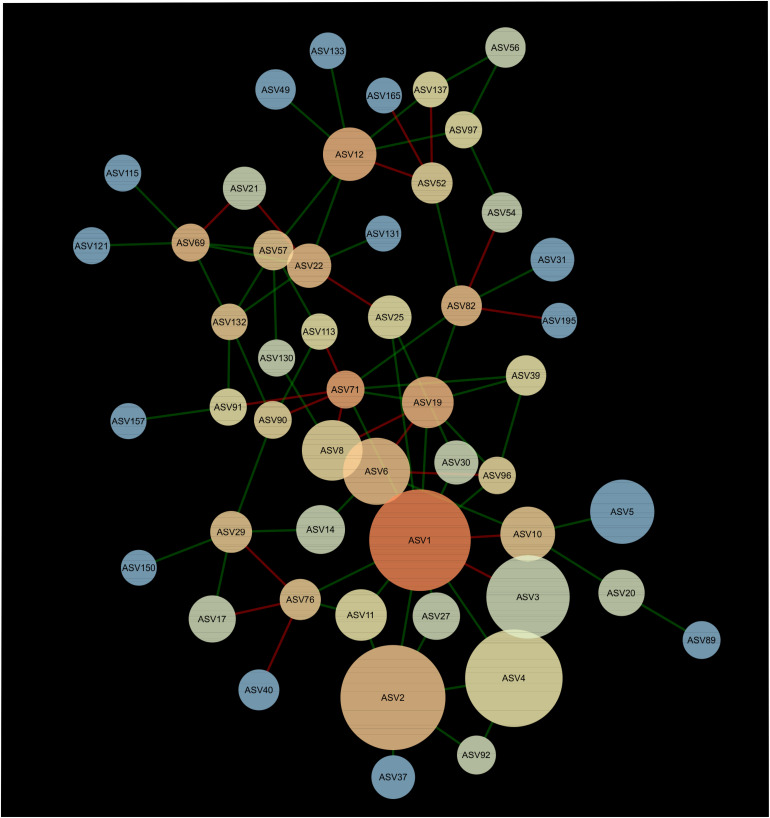
FIGURE 3.
Network of interactions between the bacteria forming the microbiome of canola rhizosphere in 2016. Dot size is proportional to relative abundance of ASV, and shades indicate the degree of betweenness centrality: ASVs with warm colors are more connected with the other members of the network than the cold colored ones. Green edges indicate positive relationships and red edges, negative relationships.

