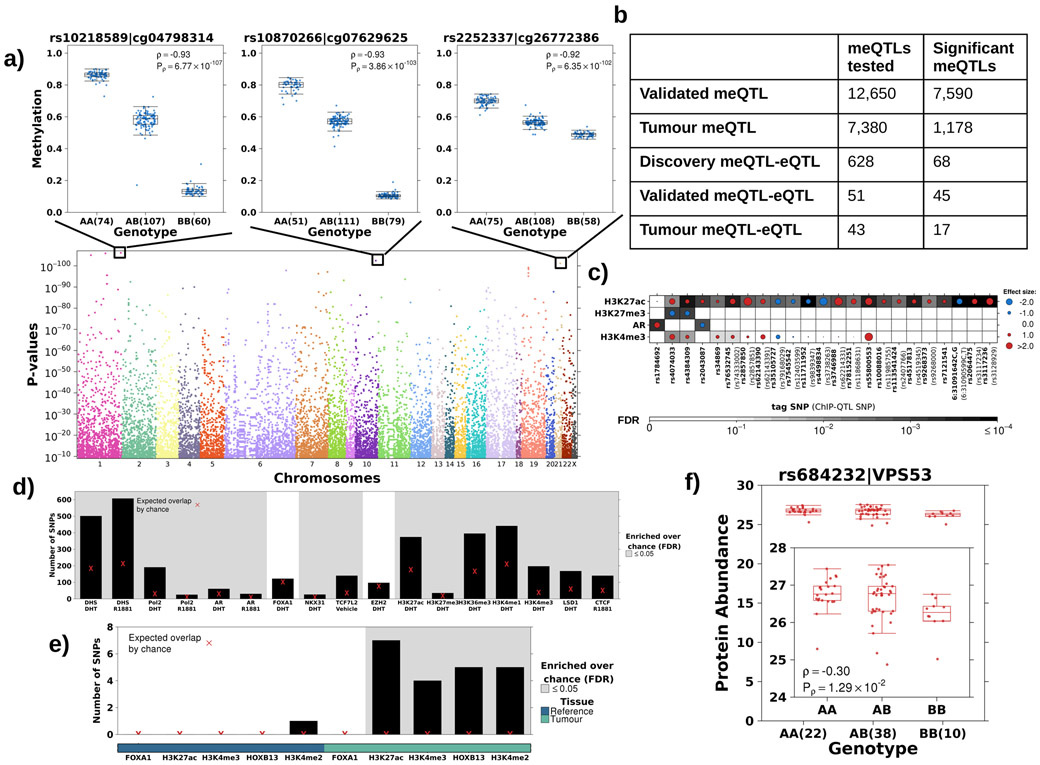
Figure 3 – The landscape of cis tumour meQTLs.
a) Identification of cis tumour meQTLs methylome-wide (P<3x10⁻⁹; Bonferroni adjustment). Each point represents a SNP, ordered by chromosome along x-axis. Y-axis gives p-value from Spearman’s correlation. Representative boxplots, showing methylation (y-axis) discretized by genotype (x-axis), for three germline-methylation associations. Boxplot represents median, 0.25 and 0.75 quantiles with whiskers at 1.5x interquartile range. Blue points refer to methylation values and number of samples with each genotype is given in brackets. b) Table shows number of meQTLs tested and statistically significant (FDR<0.05 based on Spearman’s correlation) at each stage. c) Tumour meQTLs demonstrated allele specific AR binding or histone modification (n=30; 23 unique SNPs). Circle size and colour represents magnitude and sign of coefficient from logistic regression model (i.e. red indicates alternate allele associated with increased binding and blue decreased binding). Background shading represents FDR. X-axis labels show tag tumour meQTL-ChIP-QTL and SNP ID in brackets indicate the ChIP-QTL SNP in the case that the ChIP-QTL SNP is not the tag SNP. d) Tumour meQTLs were enriched at transcription factor binding sites and active regulatory elements in LNCaP cells. Y-axis shows number of tumour meQTLs that overlap each target/treatment pair. Background shading indicates FDR<0.05 from permutation analysis (n=105 permutations). Red X represents expected number of overlapping loci by chance. e) Tumour meQTLs were interrogated for overlap with sites of allelic imbalance at FOXA1, H3K27ac, H3K4me3, HOXB13 and H3K4me2 peaks in tumour and reference tissue. Y-axis shows number of tumour meQTLs that overlap each target. Background shading indicates FDR<0.05 from permutation analysis (n=105 permutations). The bottom covariate indicates sites of allelic imbalance in tumour or reference tissue. Red X represents expected number of overlapping loci by chance. f) The tumour meQTL-eQTL-pQTL identified in this analysis is in LD with the risk locus, rs684232, which is also a pQTL for VPS53. Boxplot represents median, 0.25 and 0.75 quantiles with whiskers at 1.5x interquartile range and red points refer to protein abundance values. The number of samples with each genotype is given in brackets.

