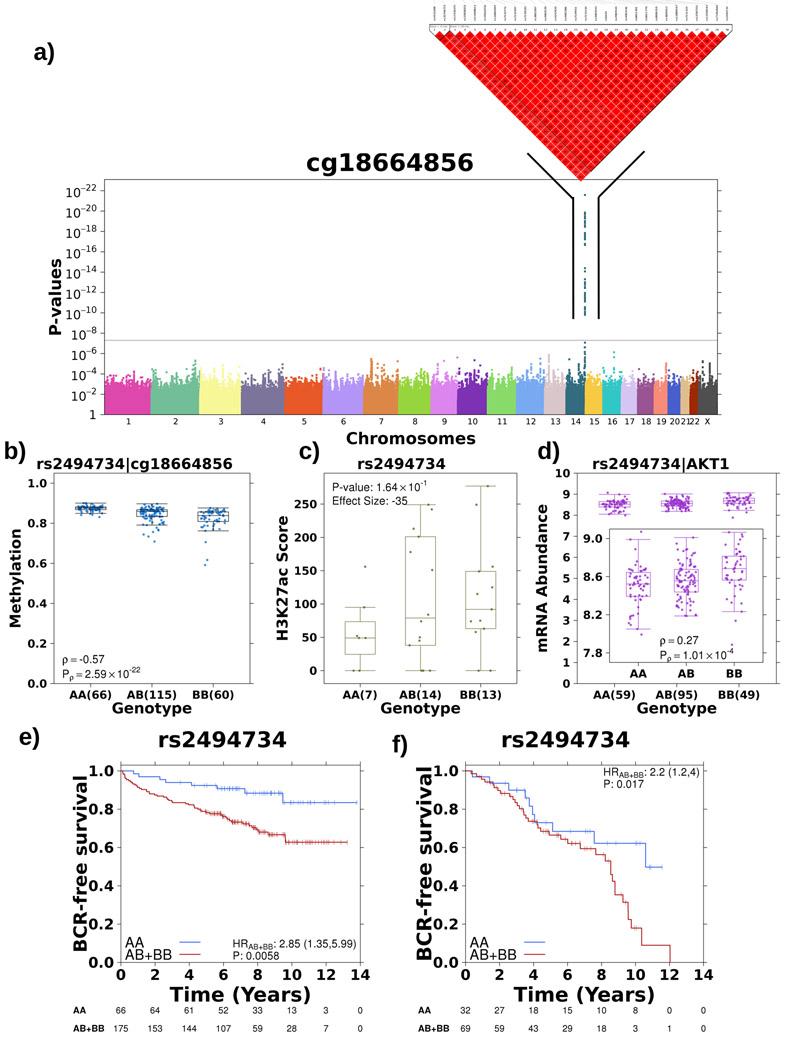
Figure 5 – Tumour meQTL associated with AKT1 regulation.
a) Haplotype on chromosome 14 strongly associated with methylation of a probe within the gene body of AKT1. Manhattan plot represents p-values from Spearman’s correlation as outlined previously. b) The alternative allele is associated with decreased methylation of cg18774856, effect quantified by Spearman’s correlation. Boxplot represents median, 0.25 and 0.75 quantiles with whiskers at 1.5x interquartile range and blue points refer to methylation values. The number of samples with each genotype is given in brackets. c) The alternative allele showed increased H3K27ac modification in this region, effect quantified by Mann-Whitney test (AA vs. AB+BB) and effect size gives difference in medians. Green points refer to H3K27ac ChIP-Seq signal. d) The alternative allele was associated with increased mRNA abundance of AKT1, effect quantified by Spearman’s correlation. Purple points refer to mRNA abundance. e) The presence of the alternative allele confers a survival disadvantage as presented in Kaplan-Meier plot with time along the x-axis in years and estimated proportion of individuals without biochemical recurrence event on y-axis. The hazard ratio from a CoxPH model is also presented along with the number of individuals without an event in each group at each time point along the bottom. f) Alternative allele at rs2456274 is dominantly associated with rapid biochemical recurrence in an independent cohort (n=101).

