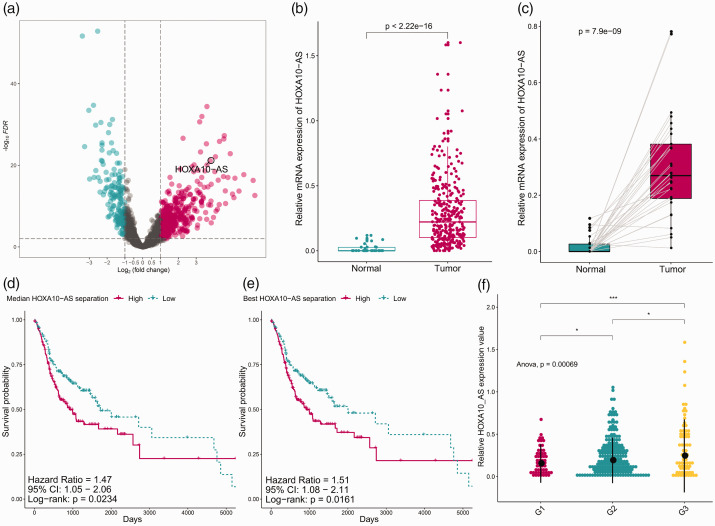
Figure 1.
HOXA10-AS expression and its clinical significance. (a) Volcano plot showed differentially expressed lncRNAs between normal and OSCC samples. (b) Boxplots indicated that lncRNA HOXA10-AS was upregulated. (c) Pairwise boxplots indicated that HOXA10-AS was highly expressed in tumor samples. (d) Analysis of relationship between HOXA10-AS expression and grades. (e, f) Kaplan–Meier curves show overall survival time between HOXA10-AS low- and high-expression groups. HOXA10-AS, HOXA10 antisense RNA; lncRNA, long noncoding RNA; OSCC, oral squamous cell carcinoma; FDR, false discovery rate.

