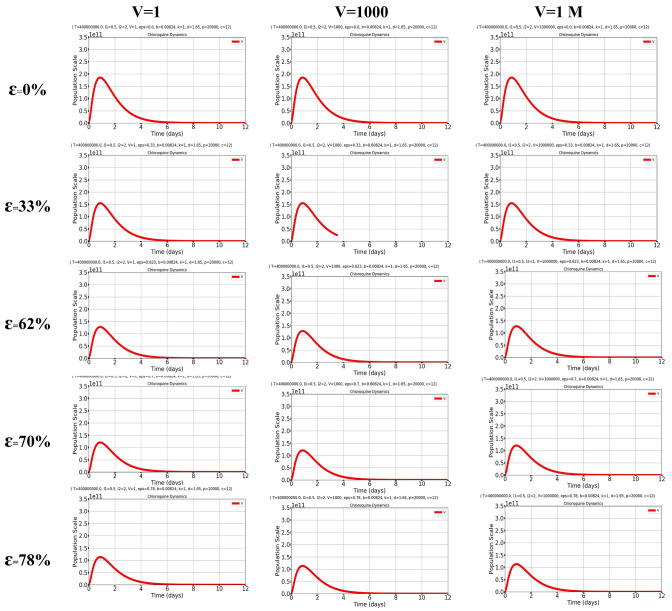
Fig. 2.
Simulation plots under k = 1/day, T = 4e8 (initial value [24]), = 1.65/day, p = 2e4 [46], β = 8.24 × 10e−3 [21] and V0 at initial {11, 103, 106} copies/ml describing the dynamics of reduction in viral load under six drug efficacy (ɛ) conditions. Baseline conditions with ε = 0, ε = 33%, ε = 62.3%, ε = 70% and ε = 78%. The results obtained should be compared with the first row of graphs in Fig. 1, simulating a condition in the absence of chloroquine/hydroxychloroquine. The first row of the present figure instead aims at simulating the effect of a drug or intervention able to increase the death of infected cells but having no antiviral effect per se

