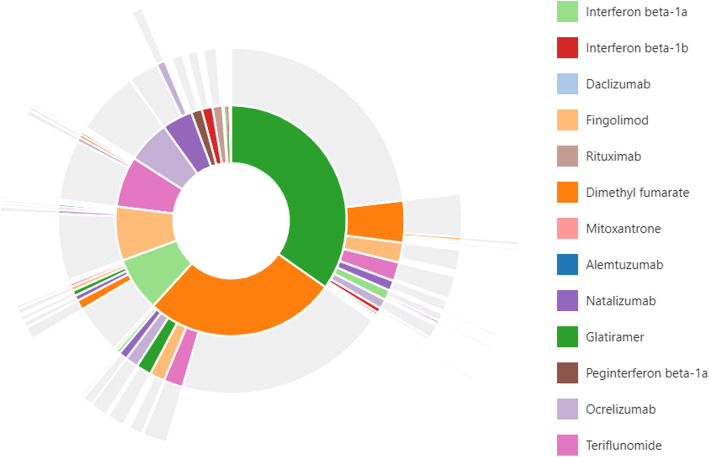
Fig. 1.
Sunburst of treatment patterns starting with first line (inner-most donut) to fourth line (outer slices). Each color represents a distinct medication, and each layer represents a new treatment line and illustrates the sequence in which patients received different therapies; for example the large green piece in the middle indicates first-line glatiramer use, and the dark orange slice on the next outer ring adjacent to the green indicates a switch from glatiramer to dimethyl fumarate. Slices that have multiple colors indicate combination therapy with more than one medication. Slices in grey indicate no additional medication was taken

