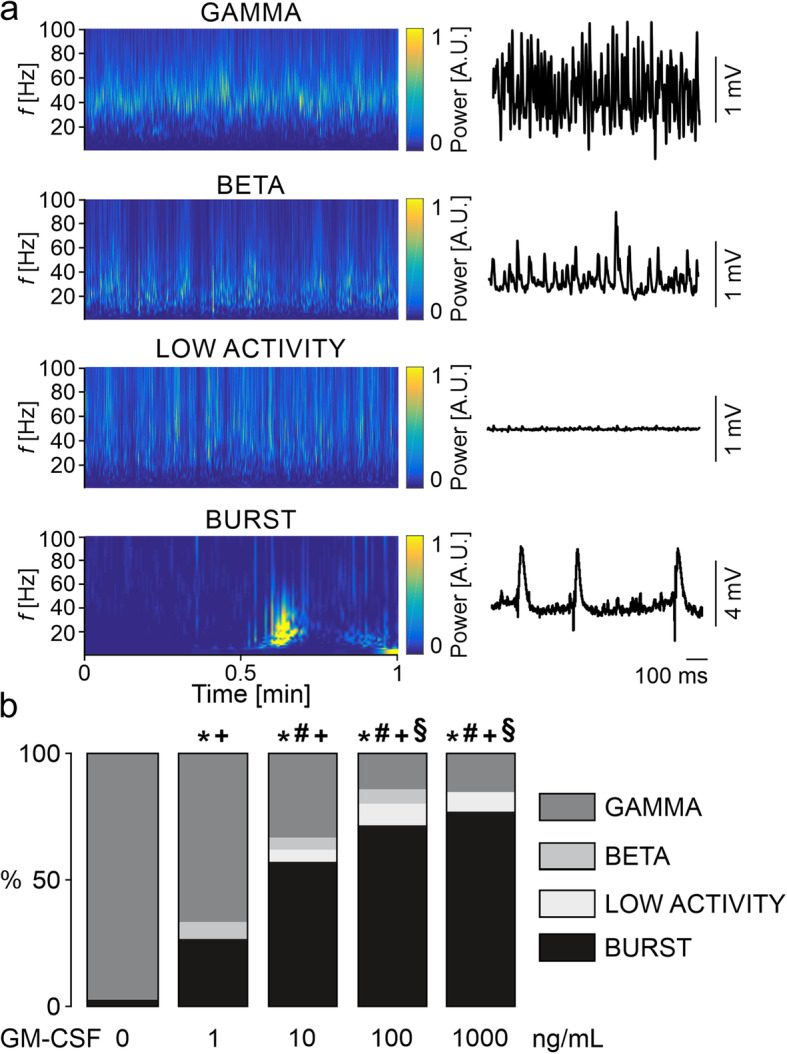
Fig. 3.

GM-CSF disturbs neuronal gamma oscillations. a Sample traces of the different neuronal network activities (right) are shown accompanied by Morlet wavelets (spectrograms, left) of the same state. LFP recordings were performed in the stratum pyramidale of the hippocampal CA3 region. b Distribution of network activities in naïve control slices (0 ng/mL) and slices exposed to different concentrations of GM-CSF. Values represent percentage of network activity type and were compared using the chi-square test. All groups were compared in respective to the presence of gamma oscillations (GAMMA vs. NO GAMMA) and recurrent neural burst firing (BURST vs. NO BURST). *P < 0.05 vs. CTL, #P < 0.05 vs. GM-CSF 1 ng/mL for GAMMA vs. NO GAMMA. +P < 0.05 vs. CTL, §P < 0.05 vs. GM-CSF 1 ng/mL for BURST vs. NO BURST. For n/N cultures/preparations: b CTL, 38/10; GM-CSF 1 ng/mL, 15/2; GM-CSF 10 ng/mL, 21/5; GM-CSF 100 ng/mL, 35/6; GM-CSF 1000 ng/mL, 26/6
