Fig. 5.

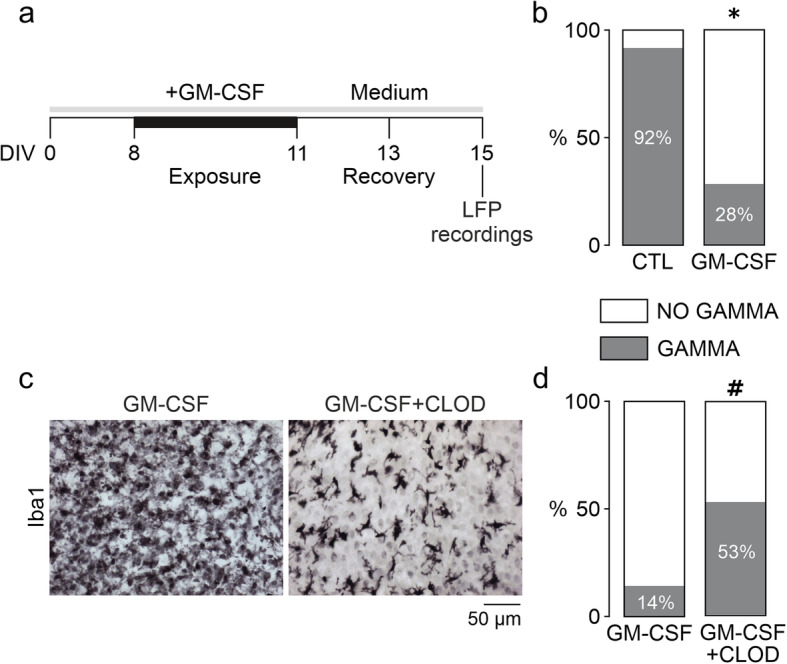
GM-CSF effects are long-lasting and attenuated by microglial depletion. a For the recovery experiment, slices were incubated with standard culture medium for further 96 h (from DIV 11 to DIV 15) after 72-h exposure to GM-CSF (100 ng/mL) (from DIV 8 to DIV 11) (membranes were washed once in culture medium before medium replacement). Naïve control slices were exposed to standard culture medium only. b Percentage of slices presenting gamma oscillations after the recovery time. For microglia-depletion experiments, slices were exposed to 100 ng/mL GM-CSF alone (GM-CSF) or in the presence of 100 μg/mL clodronate-filled liposomes (GM-CSF+CLOD). c Immunohistochemistry against Iba1. Sample images are taken from the CA3 region. Note that there is only a partial depletion of the microglial cell population (right). d Percentage of slices presenting gamma oscillations upon exposure to GM-CSF or GM-CSF plus clodronate. Values represent percentage of gamma oscillation appearance and were compared using the chi-square test (GAMMA vs. NO GAMMA). *P < 0.05 vs. CTL; #P < 0.05 vs. GM-CSF. Note that the fractions of slices expressing gamma oscillations are similar to CTL, GM-CSF (and GM-CSF+LPS) in Fig. 4a. For n/N cultures/preparations: b CTL recovery, 12/3; GM-CSF recovery, 25/3; c GM-CSF, 27/7; GM-CSF+CLOD, 9/3; d GM-CSF, 35/6; GM-CSF+CLOD, 17/3
