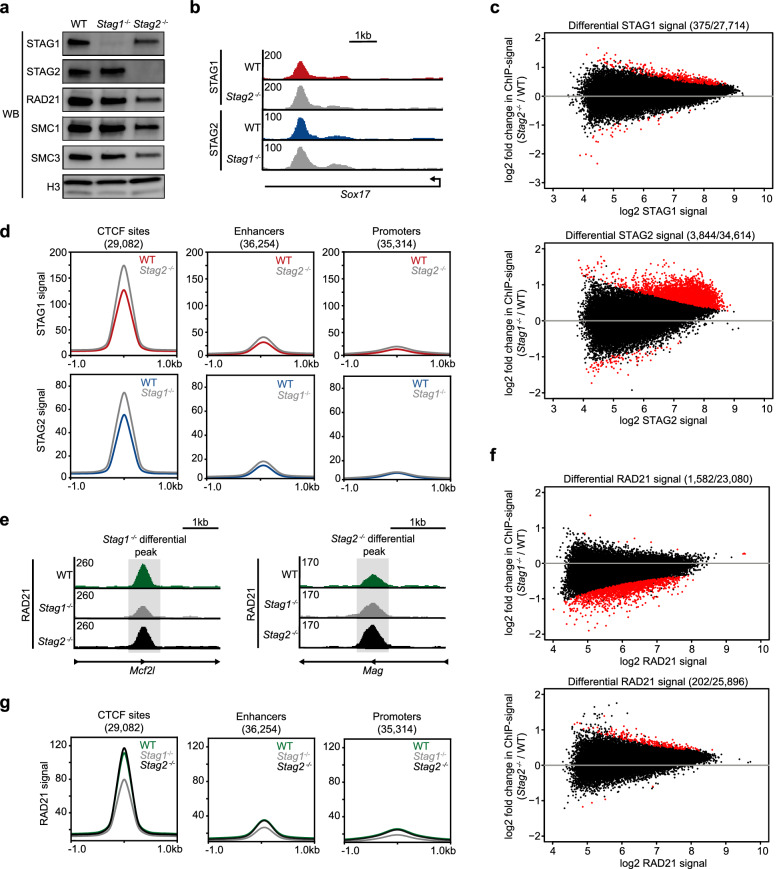
Fig. 2.
Cohesin distribution is minimally changed in Stag1−/− and Stag2−/− mESCs. a Western blot analysis of cohesin subunit levels in wild-type, Stag1−/−, and Stag2−/− nuclear lysates. b Genome browser tracks showing STAG1 signal in wild-type and Stag2−/− cells, and STAG2 signal in wild-type and Stag1−/− cells. c MA plots showing differential enrichment of STAG1 signal between wild-type and Stag2−/− cells. Differential enrichment of STAG2 signal between wild-type and Stag1−/− cells is also shown. d Average signal plots of STAG1 signal at CTCF sites, enhancers, and promoters in wild-type and Stag2−/− cells. STAG2 signal at CTCF sites, enhancers, and promoters in wild-type and Stag1−/− cells is also shown. e Genome browser tracks showing RAD21 signal in wild-type, Stag1−/−, and Stag2−/− cells at Stag1−/− and Stag2−/− differential peaks. f MA plots showing differential enrichment of RAD21 in Stag1−/− and Stag2−/− cells. g Average signal plots of RAD21 signal at CTCF sites, enhancers, and promoters in wild-type, Stag1−/−, and Stag2−/− cells

