Figure 3.

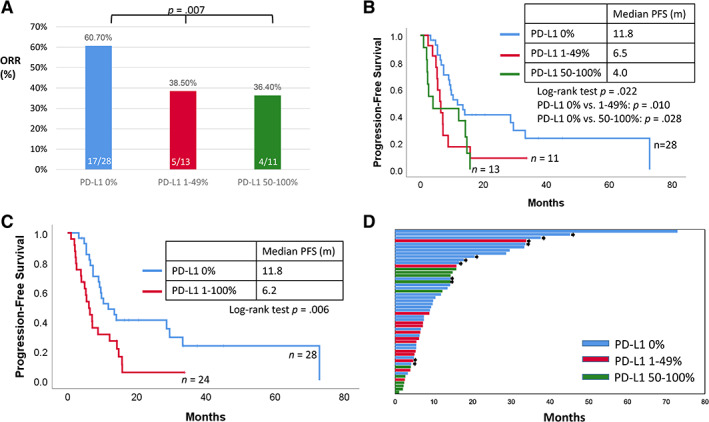
The impact of PD‐L1 on the outcomes of anaplastic lymphoma kinase‐positive patients treated with crizotinib. (A): The objective response rate in patients with PD‐L1 tumor proportion score (TPS) 0%, 1%–49%, and 50%–100% was 60.7%, 38.5%, and 36.4%, respectively. (B): The Kaplan‐Meier plot shows that the PFS of patients with PD‐L1 TPS 0%, 1%–49%, and 50%–100% was 11.8, 6.5, and 4.0 months (p = .022), respectively. (C): The Kaplan‐Meier plot shows that the PFS of patients with PD‐L1 TPS 0% and 1%–100% was 11.8 and 6.2 months (p = .006), respectively. (D): The survival plot illustrating the PFS of each patient. The bar colors of blue, red, and green refer to PD‐L1 TPS 0%, 1%–49%, and 50%–100%, respectively. The black arrowhead refers to the ongoing treatment of crizotinib at last follow‐up.
Abbreviations: ORR, objective response rate; PD‐L1, programmed death‐ligand 1; PFS, progression‐free survival.
