
Figure 2.
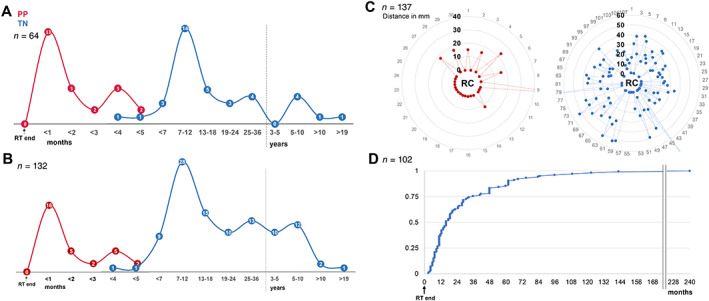
Spatiotemporal radiographic pattern of PP and TN lesions. (A): Temporal distribution of first region of interest (ROI) manifestation on magnetic resonance imaging (MRI) after RT completion. (B): Temporal distribution of overall ROI manifestation on MRI after RT completion. (C): Spatial distribution of ROIs relative to the tumor resection cavity (RC), illustrating shortest ROI‐to‐RC distances for each ROI. (D): Cumulative frequency of TN group ROI onset latency from RT completion.
Abbreviations: PP, pseudoprogression; RT, radiotherapy; TN, treatment‐induced brain tissue necrosis.