
Fig. 1 |. Overview of the data and proposed deep learning framework presented in this study.
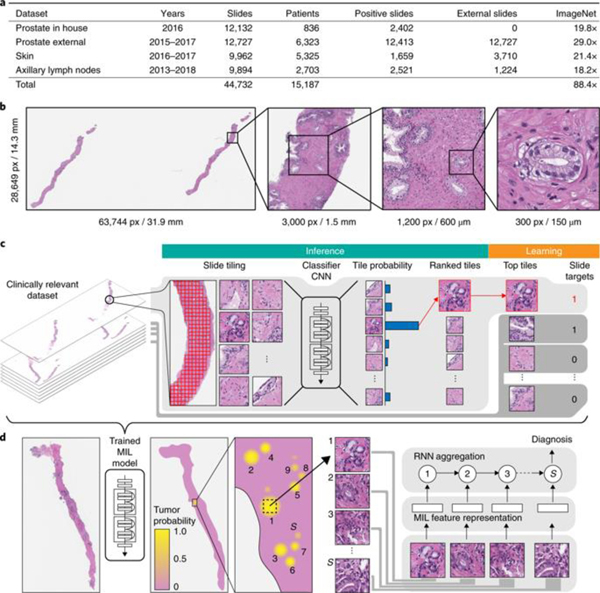
a, Description of the datasets. This study is based on a total of 44,732 slides from 15,187 patients across three different tissue types: prostate, skin and axillary lymph nodes. The prostate dataset was divided into in-house slides and consultation slides to test for staining bias. The class imbalance varied from 1:4 for prostate to 1:3 for breast. A total of 17,661 slides were submitted to MSK from more than 800 outside institutions in 45 countries for a second opinion. To put the size of our dataset into context, the last column shows a comparison, in terms of the pixel count, with ImageNet—the state of the art in computer vision, containing over 14 million images. b, Left, hematoxylin and eosin slide of a biopsy showing prostatic adenocarcinoma. The diagnosis can be based on very small foci of cancer that account for <1% of the tissue surface. In the slide to the left, only about six small tumor glands are present. The right-most image shows an example of a malignant gland. Its relation to the entire slide is put in perspective to reiterate the difficulty of the task. c, The MIL training procedure includes a full inference pass through the dataset, to rank the tiles according to their probability of being positive, and learning on the top-ranking tiles per slide. CNN, convolutional neural network. d, Slide-level aggregation with a recurrent neural network (RNN). The S most suspicious tiles in each slide are sequentially passed to the RNN to predict the final slide-level classification.