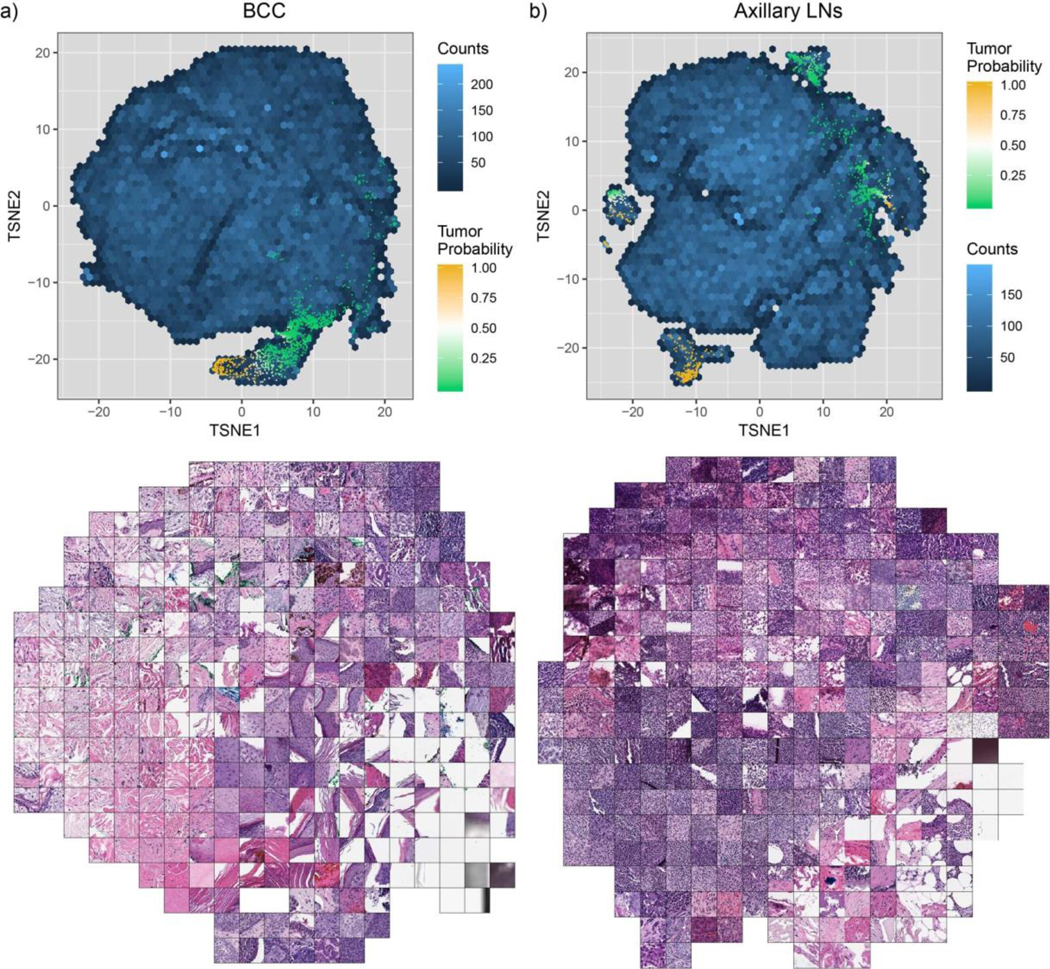
Extended Data Fig. 3 |. t-SNE visualization of the representation space for the BCC and axillary lymph node models.

Two-dimensional t-SNE projection of the 512-dimensional representation space were generated for 100 randomly sampled tiles per slide. a, BCC representation (n = 144,935). b, Axillary lymph nodes representation (n = 139,178).
