
Fig. 1.
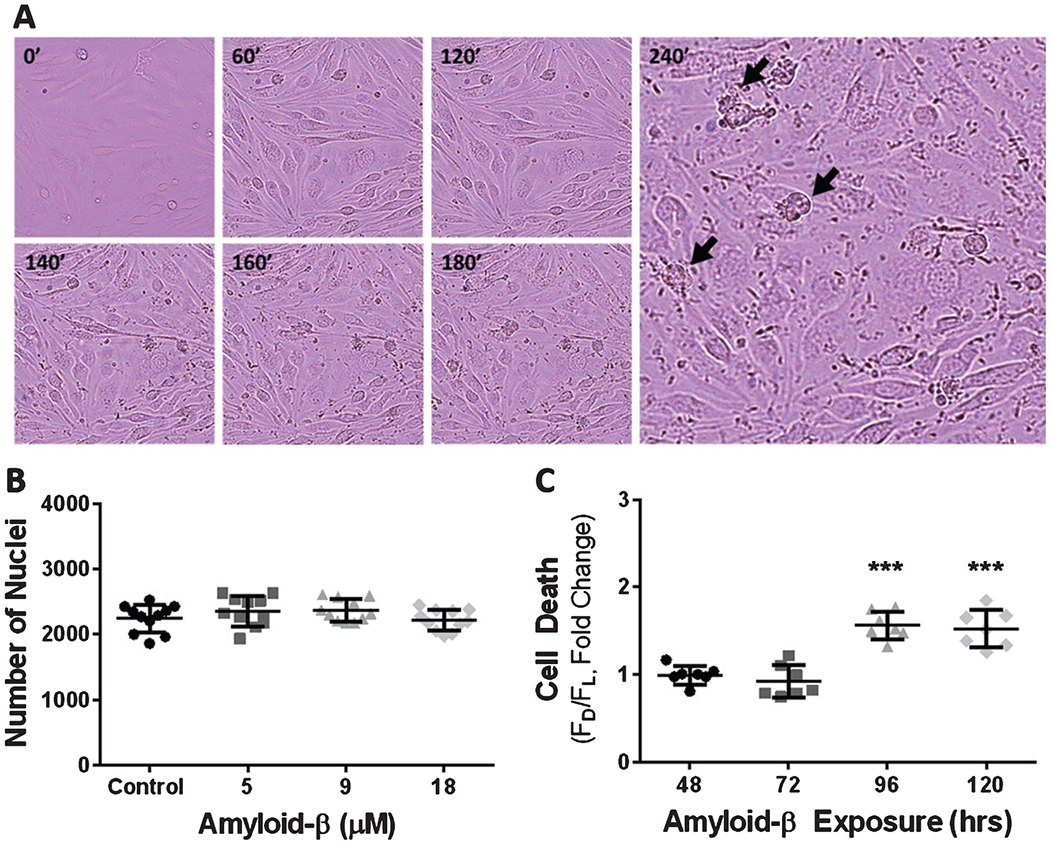
Cerebrovascular endothelial cell exposure to Aβ results in cell death. A) Brightfield micrographs depicting bEnd.3 cell death (black arrows) following exposure to 18 μM Aβ1-42 for 0, 60, 120, 140, 160, 180, and 240 min. B) Scatter plot (mean ± SD) demonstrating the average number of nuclei per well after exposure to vehicle, 5 μM Aβ1-42, 9 μM Aβ1-42, and 18 μM Aβ1-42 (n = 11 wells per group). C) Scatter plot (mean ± SD) depicting endothelial cell death after chronic exposure to 9 μM Aβ1-42 for 48, 72, 96, 120, and 144 h (n = 7 wells per group). One-way ANOVA with Dunnett’s post analysis was used to determine the level of significance between the exposure groups (***p < 0.0001).