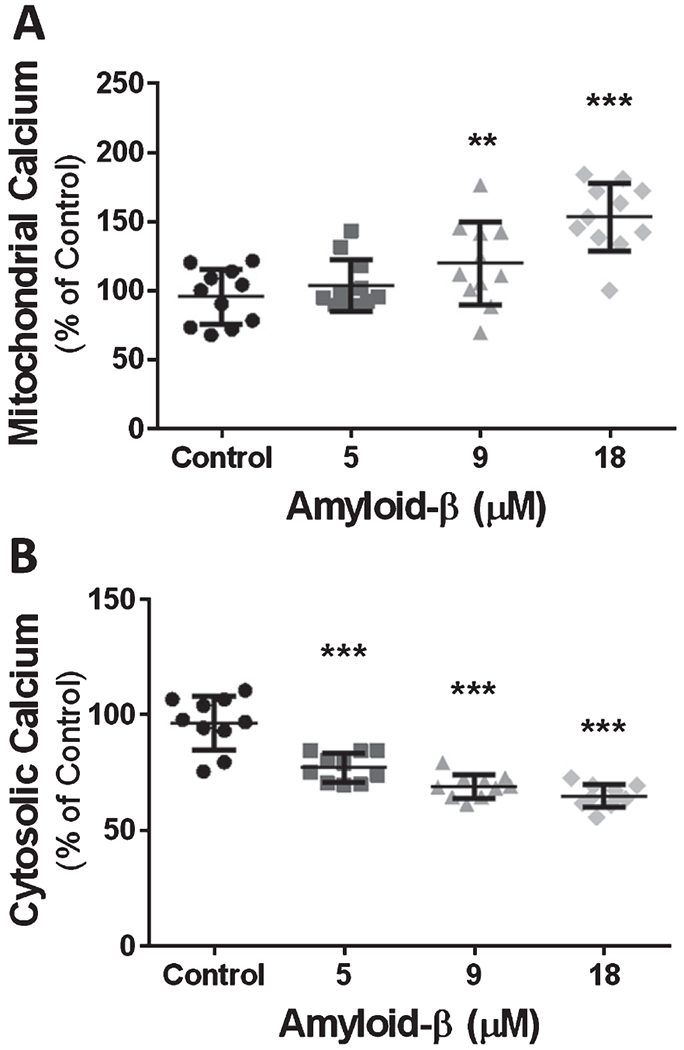
Fig. 3.

Exposure to Aβ for 24 h causes a dose-dependent increase in mitochondrial Ca2+ content and a dose-dependent decrease of cytosolic Ca2+. A) Scatter plot (mean ± SD) depicting mitochondrial Ca2+ content as percentage of vehicle treated cells, after 24 h exposure to 5 μM Aβ1-42, 9 μM Aβ1-42, and 18 μM Aβ1-42 (n = 11 wells per group). B) Scatter plot (mean ± SD) demonstrating cytosolic Ca2+ content as percentage of vehicle treated cells after 24 h exposure to 5 μM Aβ1-42, 9 μM Aβ1-42, and 18 μM Aβ1-42 (n = 10 wells per group). One-way ANOVA with Dunnett’s post analysis and linear trend analysis was used to determine the level of significance between the treatment groups (**p = 0.001; ***p = 0.0001).
