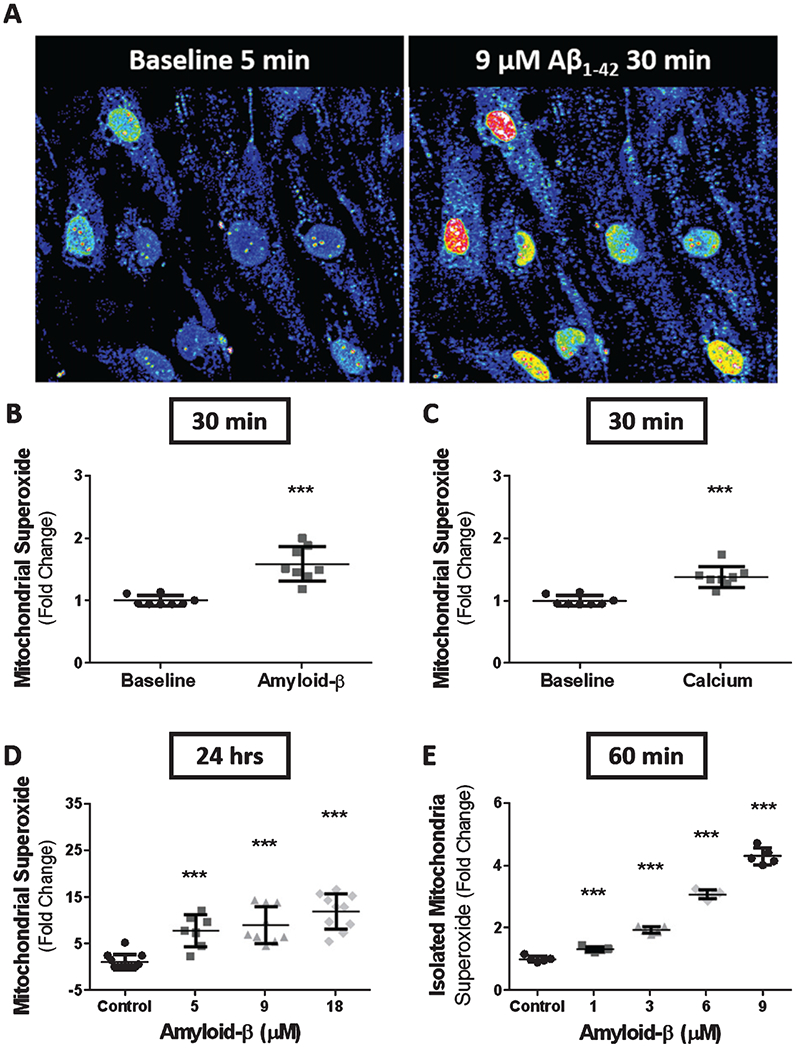
Fig. 5.

Exposure to Aβ or Ca2+ results in an increase in mitochondrial superoxide production. A) Time-lapse confocal micrographs depicting mitochondrial superoxide production in bEnd.3 cells at baseline (left) and after 30 min of exposure to 9 μM Aβ1-42 (right). Scatter plot(s) (mean ± SD) demonstrating superoxide production from time-lapse images as fold-change from baseline for bEnd.3 cells exposed to (B) 9 μM Aβ1-42 (n = 8 cells) and (C) 5mMCaCl2 (n = 8 cells) for 30 min. D) Scatter plot (mean ± SD) demonstrating mitochondrial superoxide production as fold-change in bEnd.3 cells after 24 h of exposure to vehicle, 5 μM Aβ1-42, 9 μM Aβ1-42, and 18 μM Aβ1-42 (n = 10 wells per group). E) Scatter plot (mean ± SD) depicting superoxide production as fold-change by isolated mitochondria from primary cerebrovascular endothelial cells after 1 h exposure to 0, 1, 3, 6, and 9 μM Aβ1-42 (n = 5 wells per group). Statistical analysis was performed by one-way ANOVA with Dunnett’s post analysis and linear trend analysis to determine the level of significance (***p = 0.0001).
