
Fig. 6.
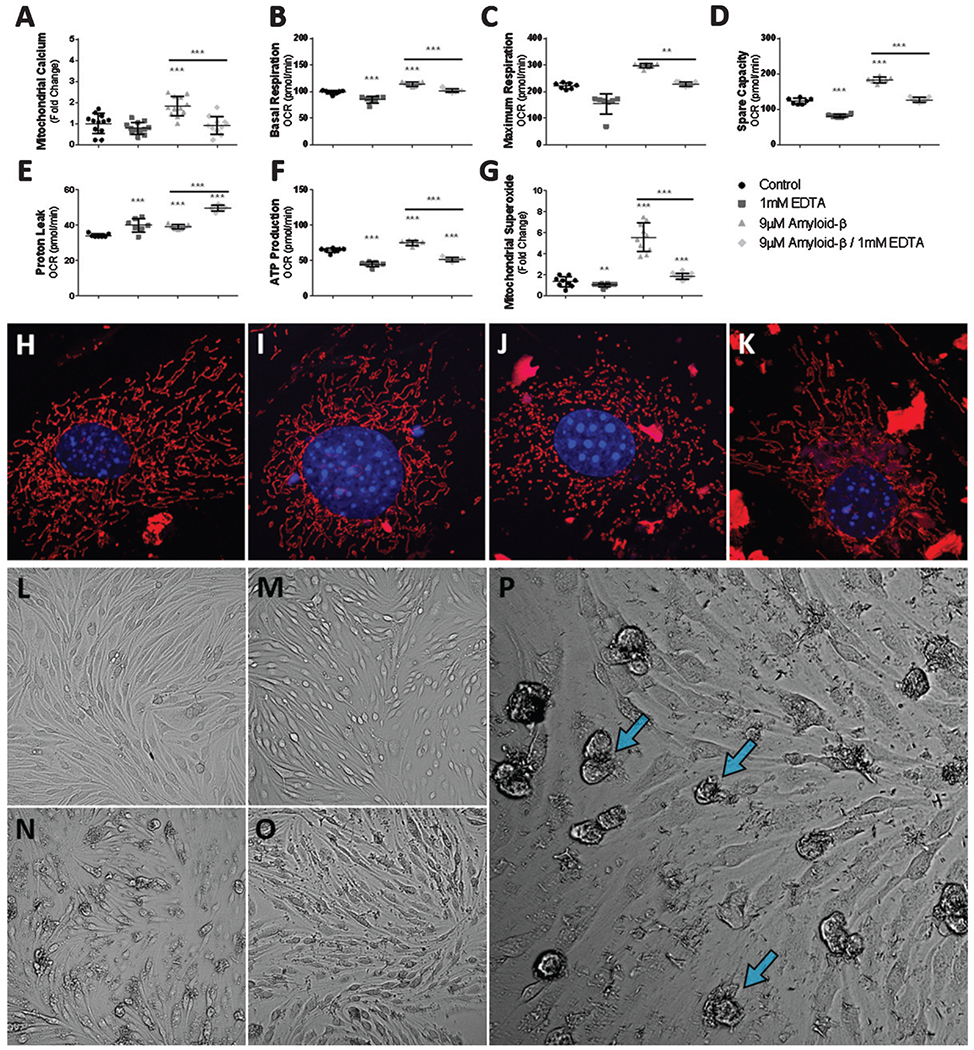
Ca2+ chelation reduces the Aβ induced hyper-oxidative state of mitochondria and superoxide production via reduced mitochondrial Ca2+ uptake. A) Scatter plot (mean ± SD) demonstrating mitochondrial Ca2+ accumulation as fold-change in bEnd.3 cells after 24 h exposure to vehicle control, 1 mM EDTA, 9 μM Aβ1-42, and 9 μM Aβ1-42 with 1 mM EDTA (n = 12 per group). Scatter plot (mean ± SD) demonstrating mitochondrial oxygen consumption (pmol/min) by (B) basal respiration, (C) maximum respiration, (D) spare capacity, (E) proton leak, and (F) ATP production from bEnd.3 cells after 24 h exposure to vehicle control, 1 mM EDTA, 9 μM Aβ1-42, and 9 μM Aβ1-42 with 1 mM EDTA (n = 7 wells per group). G) Scatter plot (mean ± SD) demonstrating mitochondrial superoxide production as fold-change in bEnd.3 cells after 24 h exposure to vehicle control, 1 mM EDTA, 9 μM Aβ1-42, and 9 μM Aβ1-42 with 1 mM EDTA (n = 10 wells per group). Confocal micrographs at 63x magnification depicting mitochondrial fragmentation (red) and nuclei (blue) in bEnd.3 cell exposed to (H) vehicle, (I) 1 mM EDTA, (J) 9 μM Aβ1-42, and (K) 9 μM Aβ1-42 with 1 mM EDTA. Note mitochondria morphology depicted in panel J, demonstrating numerous fragmented and punctated mitochondria while panel(s) H-I, K depict(s) complex and elongated mitochondria. Brightfield micrographs depicting bEnd.3 cell death (blue arrows) following exposure to 9 μM Aβ1-42 after 24 h exposure to (L) vehicle control, (M) 1 mM EDTA, (N, P) 9 μM Aβ1-42, and (O) 9 μM Aβ1-42 with 1 mM EDTA. One-way ANOVA with Dunnett’s post analysis was used to determine significance compared to control while a student’s 2-tailed t-test was used to compare the mean(s) of the 9 μM Aβ1-42 group and the 9 μM Aβ1-42 with 1 mM EDTA experimental group (*p < 0.05; **p < 0.001; ***p < 0.0001).