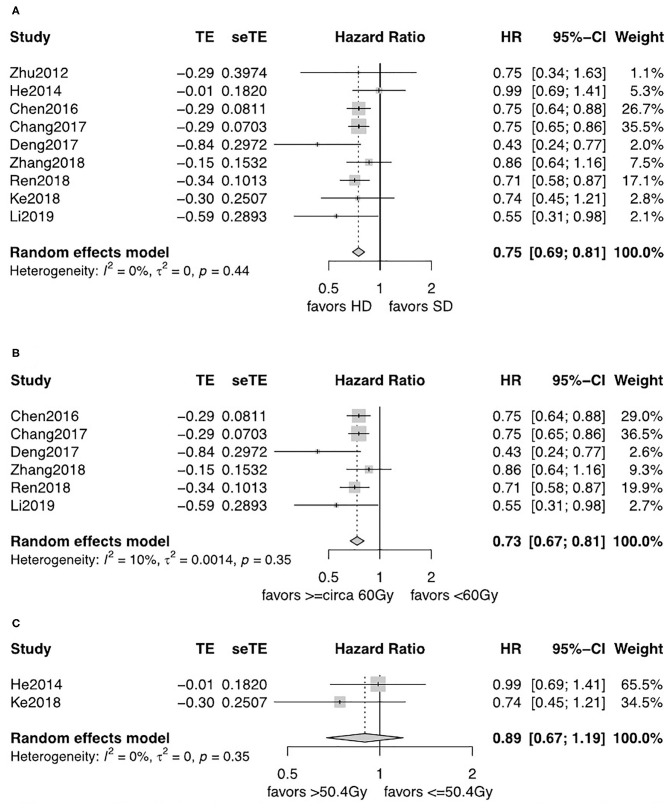
Figure 3.
(A) Forest plot of hazard ratio (HR) of OS in comparison of LD-RT group to HD-RT group for SCC; Publication bias: Begg's test, P = 0.21; Egger's test, P = 0.56. (B) Forest plot of hazard ratio (HR) of OS in comparison of LD-RT subgroup (<circa 60 Gy) to HD-RT subgroup (≥circa 60 Gy) for SCC; Publication bias: Begg'stest, P = 0.051; Egger's test, P = 0.13. (C) Forest plot of hazard ratio (HR) of OS in comparison of LD-RT subgroup (>50.4 Gy) to HD-RT subgroup (>50.4 Gy) for SCC. CI, confidence interval; HD, high dose; LD, low dose; RT, radiotherapy.

