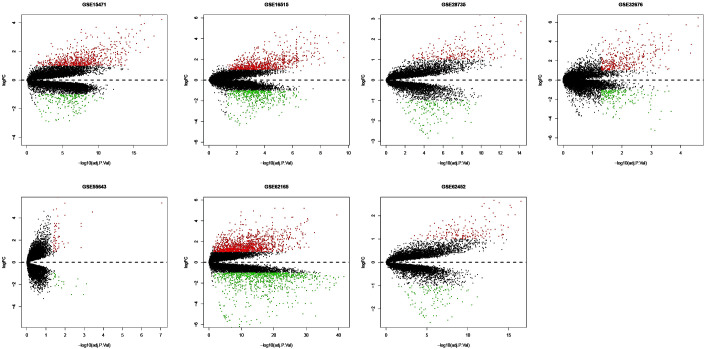
Figure 2.
Volcano plots of differentially expressed genes in the Gene Expression Omnibus database. The red dots represent the upregulated genes, the green dots represent the downregulated genes and the black spots represent genes with no significant difference in expression. FC, fold-change; adj P Val, adjusted P-value.

