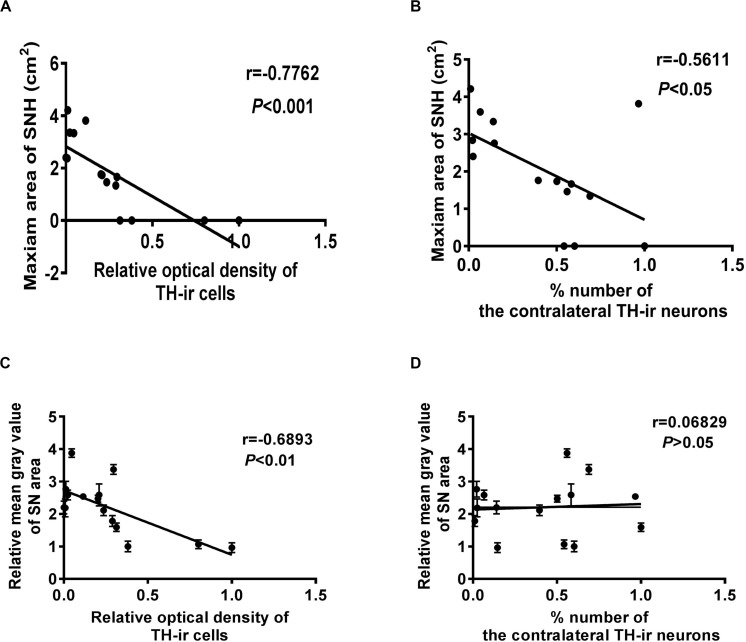
FIGURE 4.
Correlation analysis between different qualification standards of dopaminergic neuron survival and substantia nigra hyperechogenicity (SNH) in Parkinson’s disease (PD). (A) Correlation analysis between optical density (OD) values of TH-ir cells and maximum SNH area under transcranial sonography (TCS). P = 0.0007, r = –0.7762, R2 = 0.6025, F = 19.7. (B) Correlation analysis between TH-ir cell numbers and maximum SNH area under TCS. P = 0.0296, r = –0.5611, R2 = 0.3148, F = 5.972. (C) Correlation analysis between OD values of TH-ir cells and mean gray values of substantia nigra (SN) under TCS. P = 0.0045, r = –0.6893, R2 = 0.4752, F = 11.77. (D) Correlation analysis between TH-ir cell numbers and mean gray values of SN under TCS. P = 0.8089, r = 0.06829, R2 = 0.004664, F = 0.06092.

