

Abstract
Background
Many over the counter and consumer packaged goods are promoted to enhance the appearance of hair, skin, and nails for the consumer. Nutrition is a major factor in affecting the health and appearance of hair, skin, and nails. In addition to how one eats, dietary supplementation may play a role in overall health and in the physical appearance.
Aims
It was the aim of this study to objectively and subjectively evaluate the impacts of a nutritional intervention as compared to placebo on the appearances of hair, skin, and nails in healthy middle‐aged adults.
Methods
Randomized, double‐blind placebo‐controlled study with 88 subjects randomized evenly to Study Product (BiovaBio™ 450 mg/d, n = 44) or Placebo (n = 44) for 12‐weeks. Outcome tests included TrichoScan HD (hair), Canfield Visia®‐CR (skin), modified FACE‐Q (skin), and anchored Likert Scales (nails).
Results
Oral hydrolyzed eggshell membrane ingestion was associated with a significant improvement in facial skin appearance in crow's feet in 4 weeks and skin tone in 8 weeks, with significant impact on hair thickness, reduction in hair breakage and improvement in hair growth at 4, 8, and 12 weeks. There were no observed subjective improvements for nails (appearance, strength or growth).
Conclusions
Oral supplementation of 450 mg/d hydrolyzed eggshell membrane for 12 weeks is associated with improvement in the appearance of facial skin and hair.
Keywords: antiaging, eggshell membrane, glycosaminoglycan, hyaluronic acid, hydroxyproline
1. INTRODUCTION
In the effort to halt or slow aging, consumers often turn to interventions that may include cosmetic dermatology, over‐the‐counter products and dietary supplements. It has been estimated that in 2017, sales of products and services in this category hit $5.16 billion dollars.1 According to Nielson, in 2018, Americans spent $12 billion dollars on beauty and personal care products, with hair, skin, and nails falling under this catgory.2 While there are many products and services available to address skin and hair issues, the efficacy of many of these products and services has been questioned. Therefore, due to the extensive cost to the consumer and the need for claim substantiation of such products, evaluation of efficacy is warranted.
It is known that the appearance of the hair, skin, and nails changes as part of the aging process. This is due to normal intrinsic and extrinsic aging as well as to environment exposures such as UV sunlight. For example, the collagen density of the dermis decreases with age, which leads to a reduction in dermal thickness.3 Similar changes also impact hair and hair appearance (shine, thickness, fullness, etc), and more specifically, molecular alterations lead to structural modifications of the hair fiber, decrease in melanin production, and lengthening of the telogen phase of the hair cycle, and thus altered hair appearance and health.4 The appearance of the nails also can change due to aging, including alterations in nail thickness, contour, surface, and color.5, 6 Therefore, approaches to offset or even reverse these changes are desirable to consumers.
The hydrolyzed eggshell membrane contains a number of bioactive components that may impact the physiology and presentation of the hair, skin, or nails. For example, the eggshell membrane is rich in glycosaminoglycans (GAGs). GAGs are highly negative charged polysaccharides that appear to influence biomineralization.7 GAGs are complex molecules and can be part of larger molecules. One such example is proteoglycans, proteoglycans are glycosylated molecules where one or more specific glycosaminoglycan (GAG) and/or O‐ and N‐linked oligosaccharides are attached to a core protein. There are several types of GAGs which are typically sulfated. These include chondroitin sulfate/dermatan sulfate (CS/DS), keratan sulfate (KS), and heparan sulfate (HS)/heparin. There are four specific GAG types in the chicken eggshell, hyaluronan, keratan sulfate, chondroitin sulfate, and heparan sulfate. Hyaluronan is the most prevalent GAG in eggshell membranes.7 In addition to GAGs, eggshell membranes contain amino acids with proline being the most abundant.8 Proline and hydroxyproline, a nonessential amino acid derived from proline, are important in the for whole body collagen and protein synthesis.9 Thus, it is believed that oral sources of these nonessential amino acids can impact metabolic and physiologic processes.
Eggshell membrane contains hyaluronan, thus also contains the GAG hyaluronic acid (HA). HA production occurs in the skin and has been shown to stimulate internal production of HA with oral intake.10 HA has been found on its own to improve skin wrinkles. In a 12‐week study, oral HA and its effect on wrinkles were evaluated. Subjects ingested 120 mg of HA per day. By week eight, those randomized to the HA group achieved significant improvements in skin wrinkles (such as crow's feet, etc).11 This may be due in part to the “moisture” effect that hyaluronan has in human skin. In a recent publication, the authors stated that hyaluronan can increase skin moisture.11
Keratan sulfate (KS) is also a natural GAG occurring in the hydrolyzed eggshell membrane. In the body, KS may influence wound healing, especially that of the skin.12 Chondroitin sulfate (CS), another GAG, has also been tested for its ability to impact skin health. One recent study found oral CA was able to positively impact the dermis and lead to clinical and histopathological improvement of psoriasis.13 As the eggshell membrane also contains the GAG, heparan sulfate, it is of particular interest that a synthetic version of the glycosaminoglycan (“RGTA OTR4120”) has been in development as a heparan sulfate mimetic for the specific effect of healing burned skin.14
Perhaps due to the high concentration of GAGs and amino acids, oral supplementation of eggshell membrane has been linked with positive improvements in skin elasticity and appearance of the skin.15
It was the intent of this study to evaluate whether oral supplementation with a specific hydrolyzed water‐soluble eggshell membrane (BiovaBio™) that contains a number of bioactive compounds would have any impact on objective and subjective markers of the appearance and health of hair, skin, and nails of healthy middle‐aged adults.
2. MATERIALS AND METHODS
2.1. Enrollment criteria
For this 12‐week randomized double‐blind placebo‐controlled clinical trial, subjects were recruited who were between 35‐65 years of age, healthy (confirmed by health history, physical exam, and blood and urine testing), willing to stop using any topical or oral products (for 14 days leading into randomization) purported to influence hair, skin, or nails and to cease use of these during the duration of the study.
2.2. Clinical testing
All subjects were enrolled for this study at a single research site (QPS‐Springfield). The study was approved by Bio‐Kinetic Clinical Applications IRB, Springfield, MO as Study Number 87117. All subjects signed the informed consent prior to any study procedures being performed (Figure 1, Supplementary Figure S1).
Figure 1.
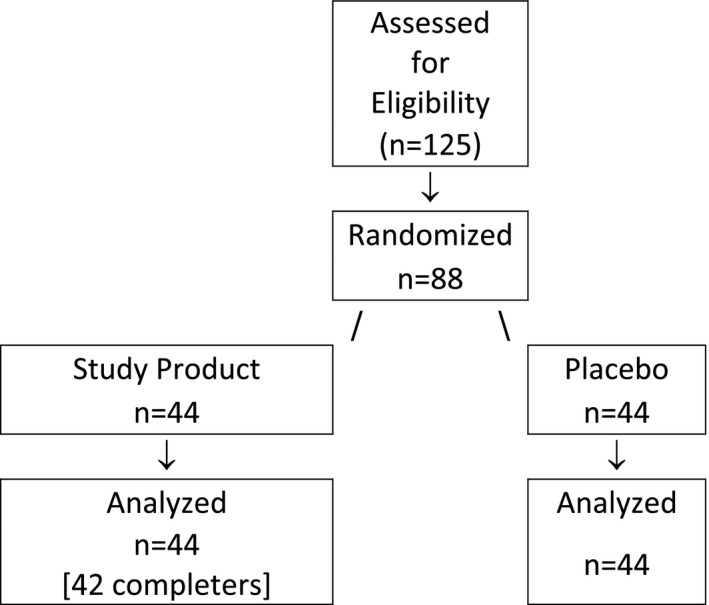
Flowchart of the clinical trial performed at QPS‐Missouri, USA
2.3. Test products
The study was performed with a specific hydrolyzed water‐soluble eggshell membrane product, BiovaBio™ (450 mg, Biova, LLC–Johnston) and a matching placebo. Study products were manufactured by Uckele Health and Nutrition, a contract manufacturer, and made to match in size, color, appearance, as to be indistinguishable from one another. Subjects were instructed to consume 450 mg of the test product or placebo once per day.
2.4. Outcome testing
Hair analysis (objective) was conducted with the TrichoScan HD. The TrichoScan is a standardized computerized high‐resolution method using to determine hair density and the status of hair roots of the scalp.16 The TrichoScan HD measures hair count, hair density, hair count of velus hair, velus hair density, percent velus hair, hair count terminal hair, terminal hair density, percent terminal hair, percent anagen hair, percent telogen hair, media hair length, hair diameter, hair length, hair follicle counts, and hair follicle density. For this study, the focus was on appearance (hair density), hair breakage (ratio of telogen hair), and growth (ratio of anagen hair).
Skin quality was conducted by two methods, Canfield Visia®‐CR (objective specialized photographic analysis) and by the subjective FACE‐Q (modified) questionnaire.17, 18, 19 The Canfield Visia®‐CR system generates high‐resolution pictures using multiple lighting modalities (using Standard 1, Blue excitation, Cross‐polarized, Parallel‐polarized, Standard 2, and Orange fluorescence modalities designed to enhance visualization of the skin features, including subsurface melanin) with the system integrated with the Vaestro® image analytical system (Vaestro Module v3.2) for outcomes analysis.17 The wrinkle analysis algorithm provides quantitative data scoring for assessing the severity of facial wrinkles and fine lines and segregates them by segments. The wrinkles are displayed in color, predefined by thickness range.
The FACE‐Q questionnaire is a validated subjective questionnaire designed to elucidate quality of life measurements as related to cosmetic and dermatological conditions on the skin.19 This study utilized a modified version of the FACE‐Q to specifically only evaluate the five specific facial areas of interest from the subjective perspective; lines between your eyebrows, crow's feet lines, horizontal forehead lines, lines on your face, and facial skin. All items were scored on an anchored five‐point Likert scale (ratings ranged from very dissatisfied to very satisfied).
To evaluate the potential impact of the study intervention on nails, each subject was asked to rate the overall appearance, strength, and growth of their respective nails. Subjects used an anchored defined five‐point Likert scale (0 = strongly disagree, 4 = strongly agree) for each individual rating. The prompting question was asked as a fill in the blank, “I like the _____of my nails,” using each outcome as the modifier.20, 21
2.5. Statistical analysis
Statistical analysis was performed using SAS® v9.3 (SAS Institute Inc) and Microsoft Excel (Microsoft Excel 2013). All analyses were conducted with descriptive statistics. Summary statistics including mean, median, standard deviation, minimum, and maximum were provided for continuous variables, such as age. Frequencies and proportions were used to summarize categorical data, such as gender. All subjects who received the study product were included in the population for demographics and baseline characteristics.
Intent‐to‐treat (ITT) population: The ITT population was defined as all subjects whose compliance rate for the daily usage of the study product was ≥85% and who had at least 1 post‐baseline efficacy assessment. The ITT population was used in the analysis of the safety and efficacy data. Baseline was defined as the last observation prior to dosing. Baseline demographic data were tabulated: these included arithmetic mean, standard deviation, median, and range (for continuous variables). The continuous variables included age, weight, height, and BMI. The categorical variables included sex, race, and ethnicity. The safety population consisted of all subjects who received any dose of study product and who had at least 1 post‐baseline safety evaluation. The paired t test or Wilcoxon sign‐rank test was used to compare the change from baseline within each group. The two‐sample t test or Wilcoxon rank‐sum test was used to compare the change from baseline between groups. Fisher's exact test was utilized to compare the difference in proportions between groups when the sample size was small; otherwise, a chi‐square test was employed. A nonhierarchal statistical approach was utilized to treat each endpoint of interest separately as an independent endpoint of interest.
3. RESULTS
This study screened 125 subjects in order to randomized 88 subjects. The 88 subjects were randomized into two groups of 44 subjects. Study subjects were in the Study Product (BiovaBio™) group or the Placebo group (Figure 1).
3.1. Baseline demographics
Eighty‐eight subjects were eligible for this study. Subjects were 53.3 ± 7.61 years old (mean ± SD). Sixty‐three subjects (71.59%) were women and 25 subjects (28.41%) were men. Regarding the vital signs at screening for all subjects, the average systolic blood pressure (mean ± SD) was 133.2 ± 14.67 mm Hg and the average diastolic blood pressure (mean ± SD) was 83.9 ± 6.07 mm Hg. The average heart rate (mean ± SD) was 75.0 ± 11.05 bpm (mean ± SD). The Study Product group was 53.8 ± 7.78 years, Placebo group 52.8 ± 7.50 years. (NS). The Study Product group was 77.27% female and 22.73% men, while the Placebo was 65.91% women and 34.09% men (NS). The Study Product BMI (kg/m2) was 28.44 ± 4.22, while the Placebo was 28.20 ± 3.83 (NS). There were no significant differences between groups at baseline.
3.2. Hair
The hair quality (Table 1) measured by the TrichoScan HD included appearance (hair density, Table 1A), hair breakage (ratio of telogen hair, Table 1B), and growth (ratio of anagen hair, Table 1C). The Study Product group achieved significant change (improvement) in hair appearance (thickness/density) by week 4 of the study, which was significantly greater than the placebo group (change from baseline score = 215.52 ± 207.898 vs 122.95 ± 204.924 n/cm2; P = .0236). The Study Product group maintained significant improvement over Placebo throughout the 12 weeks of the study (week 12 change from baseline: Study Product 369.36 ± 209.793 vs 278.52 ± 212.682 n/cm2; P = .0404). In terms of hair breakage by week 8, there was a strong trend for the Study Product group to have less hair breakage than the Placebo group (−0.78 ± 20.720 vs 6.22 ± 18.036; P = .1085). The Placebo group had a significant increase in hair breakage by week 8 (40.55 ± 16.39 at baseline to 46.06 ± 13.794 at week 8 P = .0330). By week 12, the Study Product group had no change from baseline in hair breakage, while the Placebo group trended for significant increase (baseline 40.55 ± 16.379 to 44.54 ± 14.767; P = .0998), this was no significant between the two groups (P = .4985). Hair growth analysis revealed that by week 8 the Study Product group achieved a significant improvement that also tended to be better than the Placebo for this measurement (0.78 ± 20.720 vs −6.22 ± 18.036; P = .1085). The negative hair growth rate for Placebo was significant within group (baseline 59.45 ± 16.379 to week 8 53.94 ± 13.794; P = .0330) By week 12, there were no differences between the groups in hair growth.
Table 1.
A, Trichoscan results for hair density in study cohorts. B, Trichoscan results for the ratio of telogen hair (hair breakage). C, Trichoscan results for anagen hair (growth)
| Visit (wk) | ||||
|---|---|---|---|---|
| Cohort | 0 (baseline) | 4 | 8 | 12 |
| A | ||||
| Appearance (Hair density) | ||||
| Study product | ||||
| n | 42 | 41 | 40 | 41 |
| Mean ± SD | 174 ± 52 | 392 ± 206 | 557 ± 185 | 542 ± 216 |
| Intragroup P‐score | <.0001 | <.0001 | <.0001 | |
| Placebo | ||||
| n | 42 | 44 | 43 | 43 |
| Mean ± SD | 167 ± 65 | 292 ± 202 | 465 ± 218 | 445 ± 238 |
| Intragroup P‐score | .0017 | <.0001 | <.0001 | |
| Individual changes from Baseline | ||||
| Study product | ||||
| n | 42 | 40 | 41 | |
| Mean ± SD | 215 ± 208 | 383 ± 193 | 369 ± 210 | |
| Placebo | ||||
| n | 42 | 41 | 41 | |
| Mean ± SD | 123 ± 205 | 291 ± 218 | 279 ± 213 | |
| Intergroup P‐score | .0236 | .0485 | .0404 | |
| Visit (wk) | ||||
|---|---|---|---|---|
| Cohort | 0 (baseline) | 4 | 8 | 12 |
| B | ||||
| Telogen hair (hair breakage) | ||||
| Study product | ||||
| n | 42 | 41 | 40 | 41 |
| Mean ± SD | 39 ± 15 | 46 ± 11 | 39 ± 12 | 41 ± 12 |
| Intragroup P‐score | .0128 | .8131 | .5129 | |
| Placebo | ||||
| n | 42 | 44 | 43 | 43 |
| Mean ± SD | 41 ± 16 | 50 ± 15 | 46 ± 14 | 45 ± 15 |
| Intragroup P‐score | .0008 | .0330 | .0998 | |
| Individual changes from baseline | ||||
| Study product | ||||
| n | 42 | 40 | 41 | |
| Mean ± SD | — | 7.5 ± 18 | −0.8 ± 21 | 1.9 ± 19 |
| Placebo | ||||
| n | 42 | 41 | 41 | |
| Mean ± SD | — | 10 ± 18 | 6.2 ± 18 | 4.7 ± 18 |
| Intergroup P‐score | .5285 | .1085 | .4985 | |
| Visit (wk) | ||||
|---|---|---|---|---|
| Cohort | 0 (baseline) | 4 | 8 | 12 |
| C | ||||
| Hair growth (anagen hair) | ||||
| Study product | ||||
| n | 42 | 41 | 40 | 41 |
| Mean ± SD | 61 ± 15 | 54 ± 11 | 61 ± 12 | 59 ± 12 |
| Intragroup P‐score | .0128 | .8131 | .5129 | |
| Placebo | ||||
| n | 42 | 44 | 43 | 43 |
| Mean ± SD | 59 ± 16 | 50 ± 15 | 54 ± 14 | 55 ± 15 |
| Intragroup P‐score | .0008 | .0330 | .0998 | |
| Individual changes from baseline | ||||
| Study product | ||||
| n | 42 | 40 | 41 | |
| Mean ± SD | — | −7.5 ± 18 | −0.8 ± 21 | −1.9 ± 19 |
| Placebo | ||||
| n | 42 | 41 | 41 | |
| Mean ± SD | — | −10 ± 18 | −6.2 ± 18 | −4.7 ± 18 |
| Intergroup P‐score | .5285 | .1085 | .4985 | |
Note: The P‐score is the probability of obtaining the observed results of a test, assuming that the null hypothesis is correct.
There was no statistically significant difference reported in hair breakage (ratio of telogen hair) and hair growth (ratio of anagen hair) at the end of study when compared to baseline in both Study Product and Placebo groups. However, when compared to baseline, statistically significant increases of appearance (hair density) were observed at each visit in both BiovaBio® and placebo groups. When compared between groups, the BiovaBio® group showed the greater improvement in appearance of hair (hair density) with statistically significant difference (P = .0404).
3.3. Skin analysis
Analysis of changes in skin appearance as measured by the Canfield Visia™ including the Vaestro system analysis centered on evaluation of the number and thickness of fine lines, wrinkles, and changes in skin color evenness and texture of the face (Table 2). As faces are not symmetrical, each side was analyzed separately. Both of the groups (Study Product and Placebo) experienced significant within group improvement for change in fine lines (left view). There was no comparable change in fine lines, however, on the right side. Furthermore, this difference was not significant between the groups (change from baseline Study Product −0.0052 ± 0.01264 vs Placebo −0.0065 ± 0.0158; P = .6729). Figure 2 illustrates the fine line reduction seen in two study participants after 4 weeks on the Study Product. The change in depth of wrinkles (reduction, Table 2) was significant for the Study Product group at week 12 (−1.2913 ± 3.004; P = .0089), but not for the Placebo group (right view), yet the difference between cohorts did not reach significance.
Table 2.
Canfield results for fine lines, wrinkles, and skin color in study cohorts
| Fine lines‐mean thickness (left view) | Fine lines‐mean thickness (right view) | |||||||
|---|---|---|---|---|---|---|---|---|
| Visit (wk) | Visit (wk) | |||||||
| Cohort | 0 (baseline) | 4 | 8 | 12 | 0 (baseline) | 4 | 8 | 12 |
| Study product | ||||||||
| n | 42 | 42 | 41 | 41 | 42 | 42 | 41 | 41 |
| Mean ± SD | 0.311 ± 0.033 | 0.310 ± 0.033 | 0.309 ± 0.032 | 0.306 ± 0.030 | 0.310 ± 0.030 | 0.309 ± 0.031 | 0.312 ± 0.032 | 0.311 ± 0.029 |
| Intragroup P‐score | .6437 | .4838 | .0444 | .8989 | .2426 | .4977 | ||
| Placebo | ||||||||
| n | 44 | 44 | 43 | 43 | 44 | 44 | 43 | 43 |
| Mean ± SD | 0.303 ± 0.037 | 0.301 ± 0.034 | 0.304 ± 0.036 | 0.298 ± 0.034 | 0.304 ± 0.036 | 0.305 ± 0.034 | 0.306 ± 0.037 | 0.304 ± 0.036 |
| Intragroup P‐score | .5653 | .2429 | .0087 | .7374 | .8230 | .1249 | ||
| Study product | ||||||||
| n | 42 | 41 | 41 | 42 | 41 | 41 | ||
| Mean ± SD | — | −0.001 ± 0.018 | −0.002 ± 0.017 | −0.005 ± 0.012 | — | 0.000 ± 0.014 | 0.003 ± 0.015 | 0.002 ± 0.017 |
| Placebo | ||||||||
| n | 44 | 43 | 43 | 44 | 43 | 43 | ||
| Mean ± SD | — | −0.002 ± 0.016 | −0.001 ± 0.018 | 0.007 ± 0.016 | — | 0.001 ± 0.012 | 0.001 ± 0.015 | −0.002 ± 0.013 |
| Intergroup P‐score | .4264 | .7849 | .6729 | .7570 | .4836 | .1246 | ||
| Depth of wrinkles (left view) | Depth of wrinkles (right view) | |||||||
|---|---|---|---|---|---|---|---|---|
| Visit (wk) | Visit (wk) | |||||||
| Cohort | 0 (baseline) | 4 | 8 | 12 | 0 (baseline) | 4 | 8 | 12 |
| Study product | ||||||||
| n | 42 | 42 | 41 | 41 | 42 | 42 | 41 | 41 |
| Mean ± SD | 177 ± 7.8 | 177 ± 8.0 | 177 ± 8.0 | 177 ± 7.8 | 178 ± 7.6 | 177 ± 7.1 | 176 ± 7.6 | 176 ± 7.6 |
| Intragroup P‐score | .7494 | .9039 | .3473 | .4891 | .3316 | .0089 | ||
| Placebo | ||||||||
| n | 44 | 44 | 43 | 43 | 44 | 44 | 43 | 43 |
| Mean ± SD | 175 ± 9.3 | 175 ± 9.3 | 176 ± 9.2 | 176 ± 8.7 | 176 ± 8.5 | 176 ± 8.1 | 176 ± 7.7 | 176 ± 8.2 |
| Intragroup P‐score | .7875 | .7264 | .6441 | .2807 | .3946 | .5946 | ||
| Study product | ||||||||
| n | 42 | 41 | 41 | 42 | 41 | 41 | ||
| Mean ± SD | — | −0.377 ± 4.08 | −0.055 ± 2.91 | −0.511 ± 3.44 | — | −0.342 ± 3.17 | −0.505 ± 3.29 | −1.29 ± 3.00 |
| Placebo | ||||||||
| n | 44 | 43 | 43 | 44 | 43 | 43 | ||
| Mean ± SD | — | −0.116 ± 2.83 | 0.180 ± 3.35 | 0.214 ± 3.02 | — | −0.501 ± 3.04 | −0.466 ± 3.55 | −0.286 ± 3.50 |
| Intergroup P‐score | .9415 | .7327 | .3069 | .8126 | .9590 | .1624 | ||
| Skin color evenness (left view) | Skin color evenness (right view) | |||||||
|---|---|---|---|---|---|---|---|---|
| Visit (wk) | Visit (wk) | |||||||
| Cohort | 0 (baseline) | 4 | 8 | 12 | 0 (baseline) | 4 | 8 | 12 |
| Study product | ||||||||
| n | 42 | 42 | 41 | 41 | 42 | 42 | 41 | 41 |
| Mean ± SD | 0.647 ± 0.044 | 0.652 ± 0.044 | 0.653 ± 0.045 | 0.651 ± 0.047 | 0.655 ± 0.045 | 0.660 ± 0.043 | 0.665 ± 0.043 | 0.659 ± 0.047 |
| Intragroup P‐score | .1077 | .0595 | .3184 | .1456 | .0046 | .3868 | ||
| Placebo | ||||||||
| n | 44 | 44 | 43 | 43 | 44 | 44 | 43 | 43 |
| Mean ± SD | 0.643 ± 0.071 | 0.6434 ± 0.073 | 0.648 ± 0.067 | 0.650 ± 0.064 | 0.658 ± 0.069 | 0.656 ± 0.067 | 0.660 ± 0.055 | 0.660 ± 0.057 |
| Intragroup P‐score | .7876 | .9608 | .6239 | .9132 | .1253 | .2542 | ||
| Study product | ||||||||
| n | 42 | 41 | 41 | 42 | 41 | 41 | ||
| Mean ± SD | — | 0.005 ± 0.021 | 0.007 ± 0.022 | 0.0043 ± 0.028 | — | 0.005 ± 0.021 | 0.010 ± 0.020 | 0.004 ± 0.026 |
| Placebo | ||||||||
| n | 44 | 43 | 43 | 44 | 43 | 43 | ||
| Mean ± SD | — | 0.001 ± 0.018 | −0.001 ± 0.028 | 0.001 ± 0.018 | — | −0.001 ± 0.021 | −0.004 ± 0.019 | −0.004 ± 0.023 |
| Intergroup P‐score | .2726 | .1640 | .5636 | .4241 | .0071 | .1588 | ||
Figure 2.
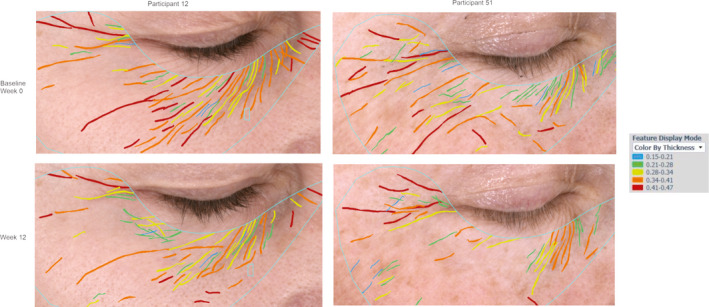
The reduction in fine lines from baseline around the eyes of two participants on the study after 12 wks on the study product, as determined by the Canfield Visia‐CR Scan using the Vaestro Wrinkle Analysis system. The width of lines detected around the eyes is segmented by color (see legend) and the lengths determined by the length of the trace. Clear reductions in the number of detected lines as well as their thickness and length are seen in both participants after 12 wks
By week 8 of the study, those in the Study Product group showed marked improvement in skin color evenness (skin tone, Table 2, Figure 3). This was significant on the right side, but short of significant on the left side. This change was also significantly greater than Placebo (change from baseline 0.0101 ± 0.020 vs −0.0044 ± 0.01862; P = .071) on the right side. At week 12, however, the differences between the two groups were no longer significant. Figure 3 shows an example of skin color evenness improvement in a subject over baseline.
Figure 3.
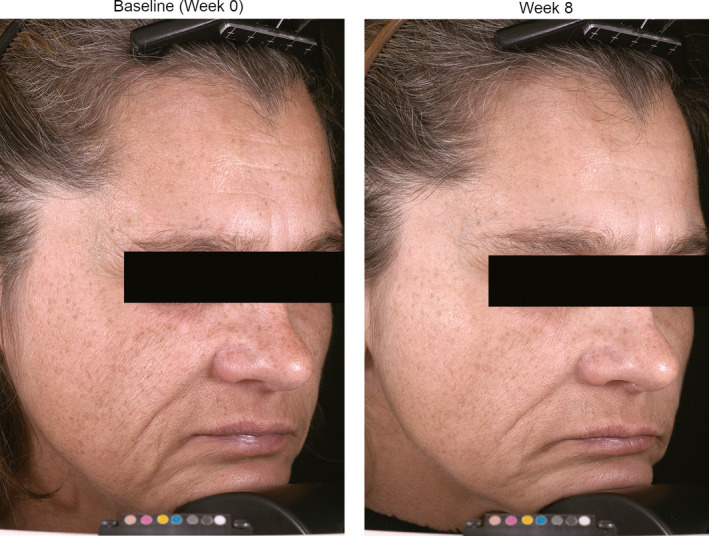
Canfield images under uniform white light of a subject at baseline (day 0) and after 8 wks on the study product. Improved color evenness is seen, particularly in the nose and forehead areas of the face
The subjective modified FACE‐Q questionnaire (analyzing for lines between the eyebrows, crow's feet, forehead lines, lines distributed over the face, and satisfaction with facial skin) data revealed some interesting findings. While both Study Product and Placebo group achieved within group significant improvements in this parameter over the course of the study, the differences between the two groups were not significant. By week 4, the Study Product group had a significant improvement in crow's feet (change from baseline −6.3 ± 15.40; P = .0113) and this remained significant throughout the study (Figure 4). By week 12, the differences between the Study Product Group and Placebo were not significant. There were no differences in subjective scores between the two groups for forehead lines, lines distributed over the face or for facial skin (complexion). In examining differences over the course of the entire study, between Study Product and Placebo for each item of the modified FACE‐Q questionnaire, the Study Product group had strong trend of showing improvement over Placebo for “how tired your crow's feet lines make you look” (P = .0724). The score for “the number of crow's feet lines you have” was significantly better (improvement) for Study Product over Placebo at week 12 (P = .0376). A trend remained favoring the Study Product group over Placebo at week 12 for “how deep the lines on your face are” (P = .0934). The rating for “how even‐colored your facial skin looks” also significantly favored Study Product over Placebo at week 12 (P = .0390). No other aspects were significant between the two groups. Figure 3 shows an example of the changes observed in this study.
Figure 4.
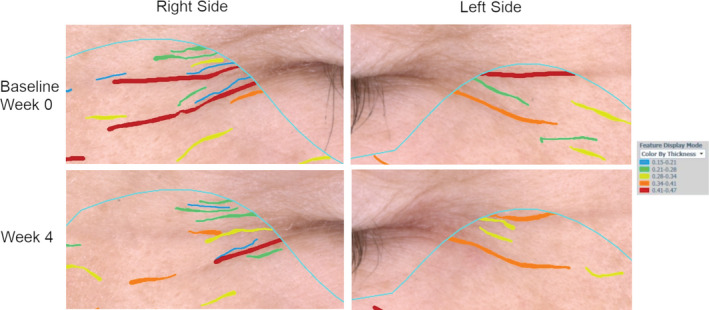
Change over baseline in crow's feet around the eyes of the study product cohort. The thickness and length of crow's feet were characterized using the Canfield Visia‐CR Scan using the Vaestro wrinkle analysis system. Thickness of the lines (in mm) is defined by color as described in the legend. The length of the crow's feet is defined by the line length. The crow's feet at the edges of both eyes were shorter and narrower after 4 wks
Nails—There were no significant differences between the two study groups for subjective ratings of nail quality as measured by three Likert scales for “overall nail appearance,” “nail strength,” or “nail growth.”
4. CONCLUSIONS
In the present study, we report that the Study Product (BiovaBio™) had physiological and statistically significant effects for positively impacting the skin and hair in middle‐aged healthy adults. The eggshell membrane, including the hydrolyzed water‐soluble eggshell membrane, is known to be rich sources of glycosaminoglycans (GAGs). Prior research has noted that GAGs as found in the Study Product can impact skin hydration and hydration through increased collagen and HA levels, by reducing matrix metalloproteinase activity, inhibition of collagenase and elastase, while reducing local skin inflammation.22, 23 In an ex vivo model, cultured human skin explants that are exposed to GAG rich content, respond by having an increase in dermal collagen and GAG content.10
This study found a significant impact on hair quality. There is evidence that GAGs are present in the hair shaft within the follicle and in the hair over the scalp area.24 GAGs and proteoglycans along with HA play a role in mammalian tissues and represent a structural and functional component of the extracellular matrix of cellular and basement membranes and of the skin and its appendages, such as the hair follicle.24 For these reasons, oral supplementation of the nutrients in the Study Product is believed to have had physiological impact on the levels of these nutrients in the hair, as it is known, the levels of these nutrients diminish with age.10 This physiologic impact was detected in an objective manner (TrichoScan HD), making the results that much more of interest and further exploration. The subjects in this study were not classified nor screened for any type of hair loss that might be disease‐ or condition‐related, as healthy subjects were enrolled; however, the results of the study should be interpreted within context as a noticeable improvement in hair thickness, growth with a reduction in hair breakage was observed at all time points in the study (week 4, week 8, and week 12).
The properties of the skin are complex due to the architecture of its different layers. In addition to this, the normal change in physiology secondary to aging (ie, reduction in collagen synthesis by up to 30% in postmenopausal years) and the potential mechanism of action for positive intervention become apparent.10, 25 We found that the oral supplementation with the Study Product had a positive impact on fine lines, wrinkles, and skin tone, which are facets of overall skin appearance. These findings are supported by other oral nutrition intervention studies where similar bioactive ingredients or sources were utilized, and similar results or the basis (the architecture) for the current results were found.10, 11, 12, 15, 22, 23 As the objective Canfield Visia‐CR™ system was utilized for skin analysis, we also employed the subjective modified FACE‐Q questionnaire as a means of capturing more robust information. The results on the subjective questionnaire in part support the objective improvements in overall skin appearance as observed with a reduction in crow's feet by week 4; however, the potential for placebo response cannot be discounted, as there were also aspects of the study that were not different between the groups.
There were no observed effects of the Study Product on the parameters of the nails as tested, this may be due to a Hawthorne effect (research participation bias) or due to the fact that a more objective measurement was not used.26 Future studies ought to employ an objective measurement of nail health.
The BiovaBio™ Study Product is known to naturally contain GAGs, amino acids, and other compounds that are found in the hair, skin, and nails. The results of this study demonstrate that the oral ingestion of BiovaBio™ leads to improvements in aspects of the appearance of the hair and skin, and thus may be an option for those interested in such effects.
Within the confines of this study, the study product (BiovaBio™) was observed to have a good safety profile. There were no serious adverse events or related adverse events in this study. There is a long history of use of eggshell membrane in the food supply including in dietary supplement form. Prior multiple published studies have not reported any safety concerns or adverse events. Those with an allergy to egg or egg products should not consume eggshell membrane.27
Supporting information
ACKNOWLEDGMENTS
The authors would like to thank the study participants for their time and participation. The authors would also like to acknowledge Luke Schneider PhD (Canterbury University, New Zealand) for his valuable input on statistical analysis and the manuscript.
Kalman DS, Hewlings S. The effect of oral hydrolyzed eggshell membrane on the appearance of hair, skin, and nails in healthy middle‐aged adults: A randomized double‐blind placebo‐controlled clinical trial. J Cosmet Dermatol. 2020;19:1463–1472. 10.1111/jocd.13275
REFERENCES
- 1. Revenue of beauty salons (hair, skin, nails) in the United States, 2012–2017. https://www.statista.com/statistics/296193/revenue-hair-and-nail-salons-in-the-us/ Accessed February 18, 2019.
- 2. The future of beauty. The Nielsen Company; https://www.nielsen.com/content/dam/nielsenglobal/de/images/WP-CH/Nielsen_2018_the-future-of-beauty-report.pdf Accessed February 18, 2019. [Google Scholar]
- 3. Shuster S, Black MM, McVitie E. The influence of age and sex on skin thickness, skin collagen and density. Br J Dermatol. 1975;93:639‐643. [DOI] [PubMed] [Google Scholar]
- 4. Goodier M, Hordinsky M. Normal and aging hair biology and structure 'aging and hair'. Curr Prob Dermatol. 2015;47:1‐9. [DOI] [PubMed] [Google Scholar]
- 5. Aging changes in hair and nails. MedlinePlus, U.S. National Library of Medicine; https://medlineplus.gov/ency/article/004005.htm Accessed February 18, 2019. [Google Scholar]
- 6. Abdullah L. Common nail changes and disorders in older people. Can Fam Physician. 2011;57(2):173‐181. [PMC free article] [PubMed] [Google Scholar]
- 7. Liu Z, Sun X, Cai C, He W, Zhang F, Linhardt RJ. Characteristics of glycoaminoglycans in chicken eggshells and the influence of disaccharide composition on eggshell properties. Poult Sci. 2016;95:2879‐2888. [DOI] [PMC free article] [PubMed] [Google Scholar]
- 8. Klingerensmith PM, McCombs JK, Addison JB. Gas chromatographic analysis of shell membrane amino acids from hard‐shelled, soft‐shelled and shell‐less eggs. Poult Sci. 1988;67(8):1203‐1209. [DOI] [PubMed] [Google Scholar]
- 9. Wu G, Bazer FW, Burghard RC, et al. Proline and hydroxyproline metabolism: implications for animal and human nutrition. Amino Acids. 2011;40(4):1053‐1063. [DOI] [PMC free article] [PubMed] [Google Scholar]
- 10. Asserin J, Lati E, Shioya T, Prawitt J. The effect of oral collagen peptide supplementation on skin moisture and dermal collagen network: evidence from an ex‐vivo model and randomized, placebo controlled clinical trials. J Cosmet Dermatol. 2015;2015(14):291‐301. [DOI] [PubMed] [Google Scholar]
- 11. Oe M, Sakei S, Yoshida H, et al. Oral hyaluronan relieves wrinkles: a double blinded, placebo‐controlled study over a 12‐week period. Lin Cosmet Invest Dermatol. 2017;10:267‐273. [DOI] [PMC free article] [PubMed] [Google Scholar]
- 12. Caterson B, Melrose J. Keratan sulfate, a complex glycosaminoglycan with unique functional capability. Glycobiology. 2018;28(4):182‐206. [DOI] [PMC free article] [PubMed] [Google Scholar]
- 13. Verges J, Montell E, Marta P, et al. Clinical and histopathological improvement of psoriasis with oral chondroitin sulfate: a serendipitous finding. Dermatol Online J. 2005;11(1):31. [PubMed] [Google Scholar]
- 14. Garcia‐Felipe S, Barbier‐Chassefiere V, Alexakis C, et al. RGTA OTR1420, a heparan sulfate mimetic, is a possible long‐term active agent to heal burned skin. J Biomed Mater Res. 2007;80A:75‐84. [DOI] [PubMed] [Google Scholar]
- 15. Aguirre A, Gil‐Quintana E, Fenaux M, Erdozain S, Sarria I. Beneficial effects of oral supplementation with Ovoderm on human skin physiology: two pilot studies. J Diet Supple. 2017;14(6):706‐714. [DOI] [PubMed] [Google Scholar]
- 16. TrichoScan HD . DermoScan GmbH; https://dermoscan.de/en/products/trichoscan-hd/. [Google Scholar]
- 17. Visia™‐CR, Canfield Sciences . Parsippany, NJ: https://www.canfieldsci.com/imaging-systems/visia-cr/ and https://www.canfieldsci.com/imaging-systems/vaestro/ [Google Scholar]
- 18. Klassen AF, Cano SJ, Schwitzer JA, Scott AM, Pusic AL. FACE‐Q scales for health‐related quality of life, early life impact, satisfaction with outcomes, and decision to have treatment: development and validation. Plast Reconstr Surg. 2015;135:375‐386. [DOI] [PubMed] [Google Scholar]
- 19. Klassen AF, Cano SJ, Schwitzer JA, et al. Development and psychometric validation of the FACE‐Q skin, lips, and facial rhytids appearance scales and adverse effects checklists for cosmetic procedures. JAMA Dermatol. 2016;152(4):443‐451. [DOI] [PMC free article] [PubMed] [Google Scholar]
- 20. Svensson E. Comparison of the quality of assessments using continuous and discrete ordinal rating scales. Biom J. 2000;42(4):417‐434. [Google Scholar]
- 21. Hasson D, Arnetz BB. Validation and findings comparing VAS vs. Likert scales for psychosocial measurements. Int Electron J Health Educ. 2005;8:178‐192. [Google Scholar]
- 22. Yoo J, Park K, Yoo Y, Kim J, Yang H, Shin Y. Effects of eggshell membrane hydrolysates on anti‐inflammatory, anti‐wrinkle, anti‐microbial activity and moisture‐protection. Korean J Food Sci Anim Resour. 2014;34(1):26‐32. [DOI] [PMC free article] [PubMed] [Google Scholar]
- 23. Yoo JH, Kim JK, Yang HJ, Park KM. Effects of eggshell membrane hydrolysates on UVB‐radiation‐induced wrinkle formation in SKH‐1 hairless mice. Korean J Food Sci Anim Resour. 2015;35(1):58‐70. [DOI] [PMC free article] [PubMed] [Google Scholar]
- 24. Maniatopoulou E, Bonovas S, Sitaris N. Isolation and quantification of glycosaminoglycans from human hair shaft. Ann Dermatol. 2016;28(5):533‐539. [DOI] [PMC free article] [PubMed] [Google Scholar]
- 25. Kohl E, Steinbauer J, Landthaler M. Skin aging. J Eur Acad Dermatol Venereol. 2011;25:873‐884. [DOI] [PubMed] [Google Scholar]
- 26. McCambridge J, Kypri K, Elbourne D. Research participation effects: a skeleton in the methodological cupboard. J Clin Epidemiol. 2014;67(8):845‐849. [DOI] [PMC free article] [PubMed] [Google Scholar]
- 27. Ruff KJ, Morrison D, Duncan SA, Back M, Aydogan C, Theodosakis J. Beneficial effects of natural eggshell membrane versus placebo in exercise‐induced joint pain, stiffness, and cartilage turnover in healthy, postmenopausal women. Clin Inter Aging. 2018;13:285‐295. [DOI] [PMC free article] [PubMed] [Google Scholar]
Associated Data
This section collects any data citations, data availability statements, or supplementary materials included in this article.
Supplementary Materials