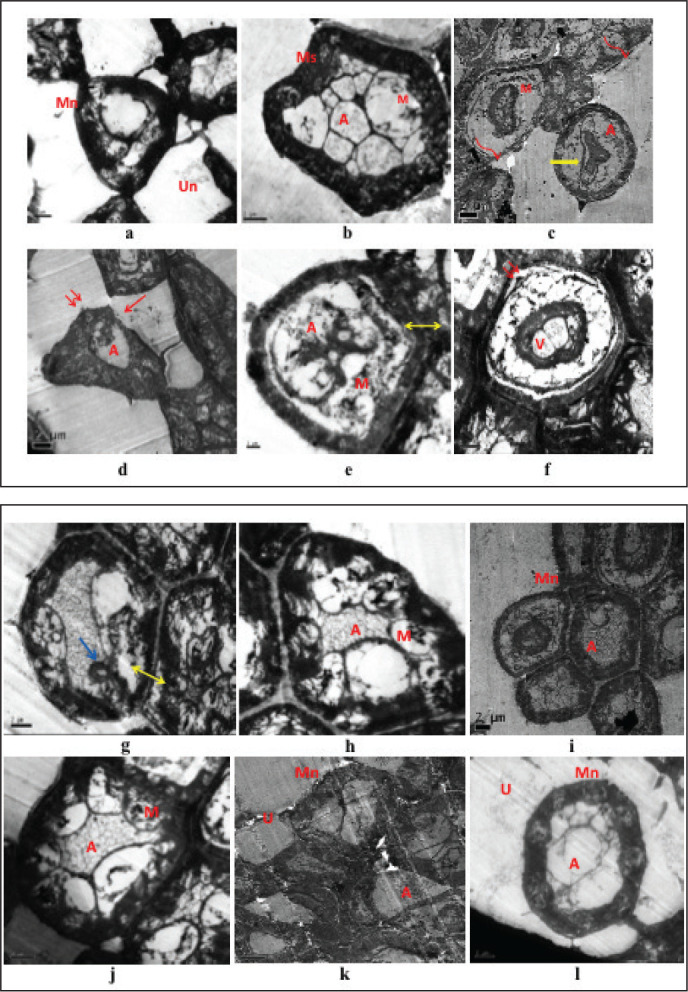
Figure 9. TEM studies for all groups (a, b) normal control (NC); (i, j) PAE received control; (k, l) ESC received control groups showing normal myelinated (Mn), unmyelinated (Un) nerve fibres, axoplasm (A) containing microtubules and mitochondria (M) wrapped in a thick myelinated sheath with compact lamellar structure and surrounded by Schwann cells. (c, d) Diabetic control (DC) group showing shrinkage of cells, myelin breakdown, discontinuous and disorganised myelin sheath (curved arrow), loss of axoplasm, focal lysis (red arrow) of myelin sheath, irregular nuclei in the blood vessels (yellow arrow), separation of myelin lamellae, loss of compact lamellar structure (double arrow), compressed and distorted axoplasm (A), swollen and destroyed mitochondria (M). (e, f) PAE treated diabetic group (D+PAE); (g, h) ESC treated diabetic (D+ESC) groups showing many axons with normal appearance of myelin sheath and endoneurium in-between, some focal lysis, focal appearance of redundant myelin (blue arrow), separation of myelin sheath from axon (double side arrow), vacuolation of the cytoplasm (V), presence of some microtubules and mitochondria (M). Scale: 2 µm.

