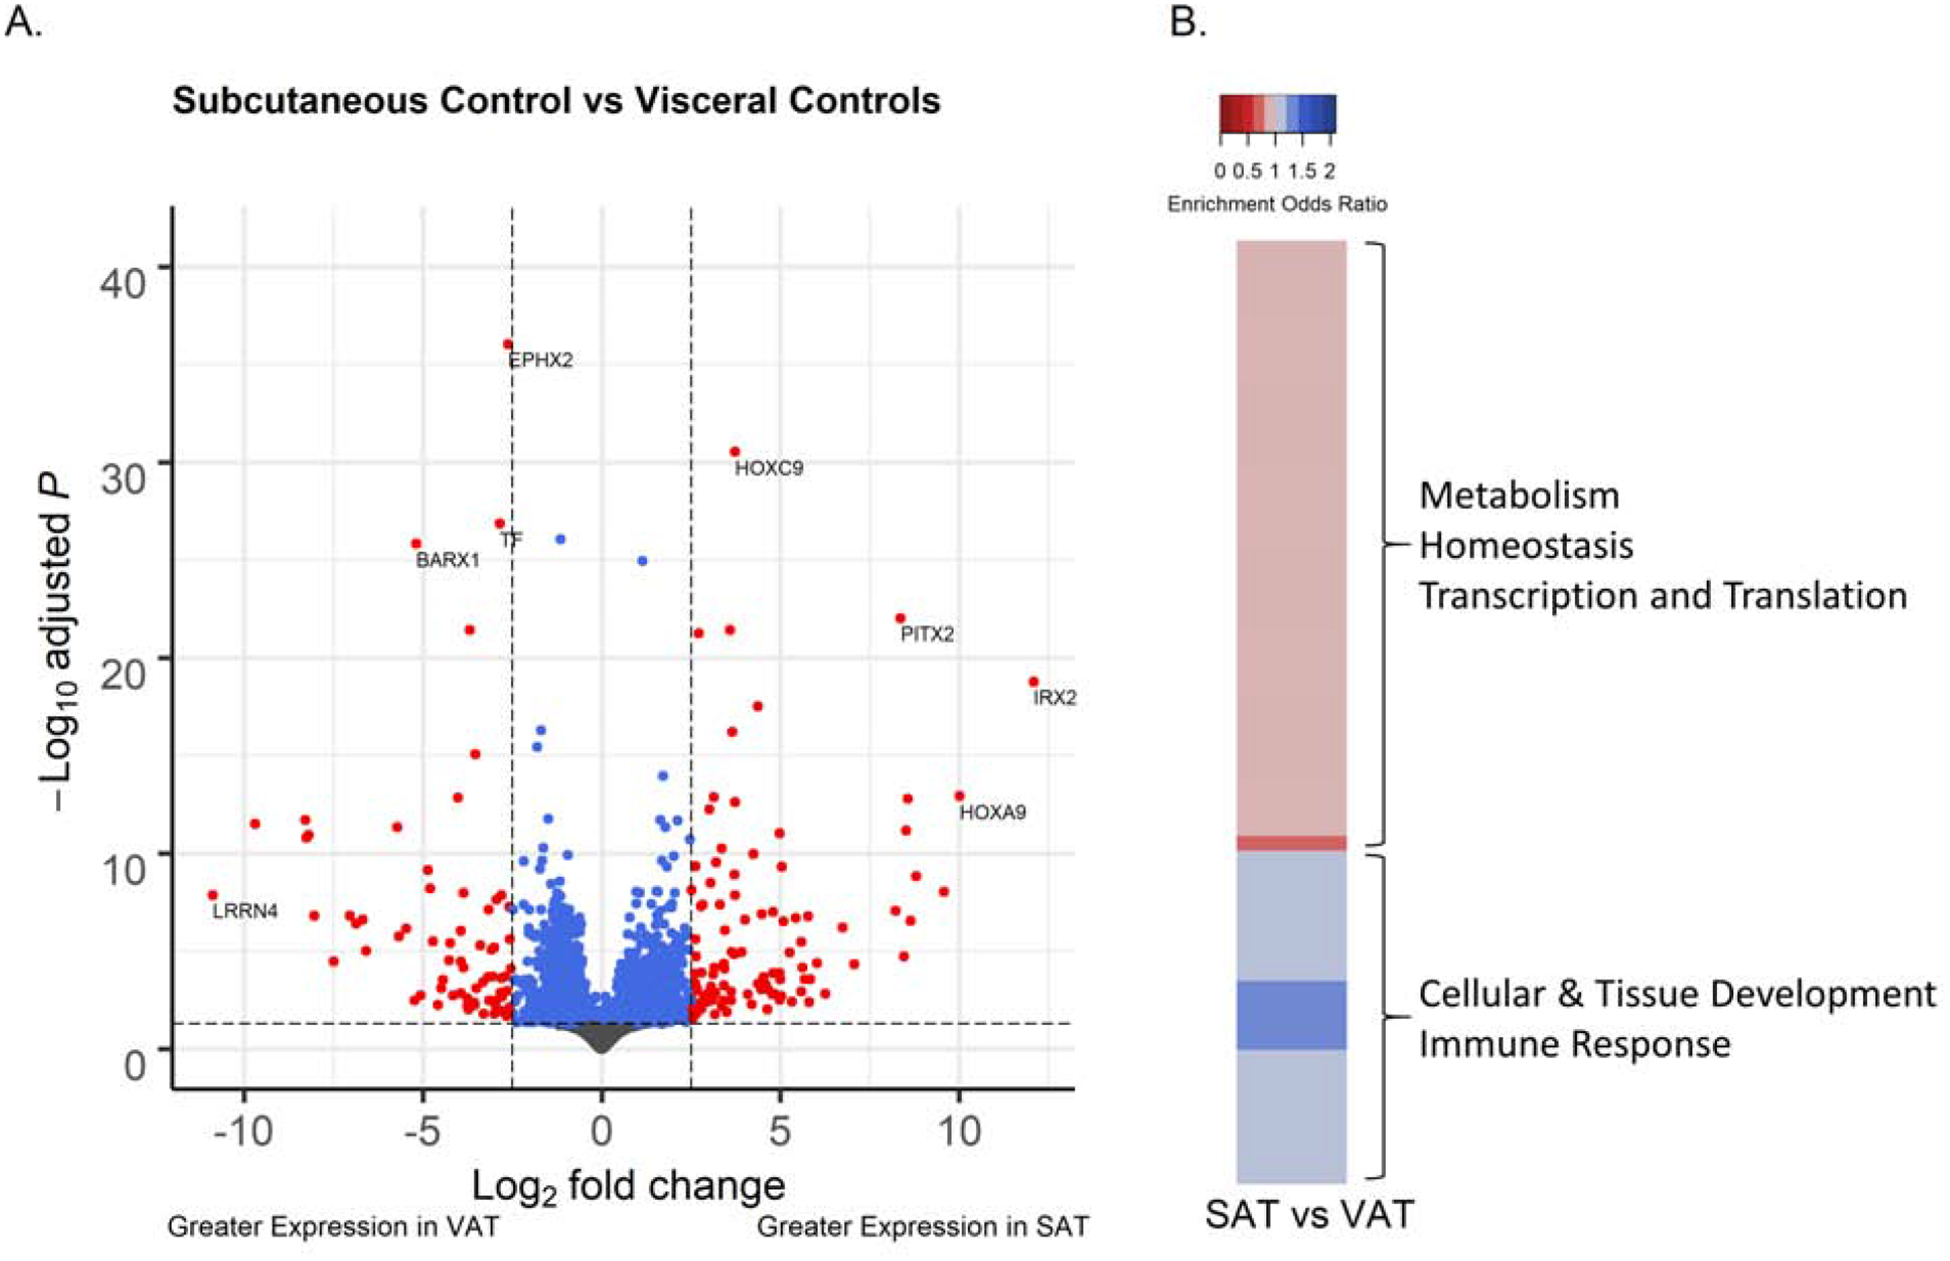
Figure 2.

Comparison of the gene expression of 21-month old female sheep in subcutaneous adipose tissue from prenatal bisphenol-A (BPA) treated and control t groups. (A) Volcano plot of differential gene expression by prenatal BPA treatment in subcutaneous adipose tissue (SAT). (B). Volcano plot of differential gene expression by prenatal BPA treatment in visceral adipose tissue (VAT). Genes are plotted by log-fold change, using “apeglm” for shrinkage, and -log adjusted p-values. Blue points have adjusted p-values < 0.05. Green points have shrunk log fold change > 1.5. Red points have both adjusted p-value < 0.05 and log fold change > 1.5. (C). Venn diagram of number of FDR significant genes in tissue comparison, BPA effect in SAT, and BPA effect in VAT. (D). Heatmap of clustering of significant genes sets from RNA-Enrich with FDR < 10−6 in either the BPA comparison in SAT or the BPA comparison in VAT. Upregulated gene sets are in blue, downregulated gene sets in red.
