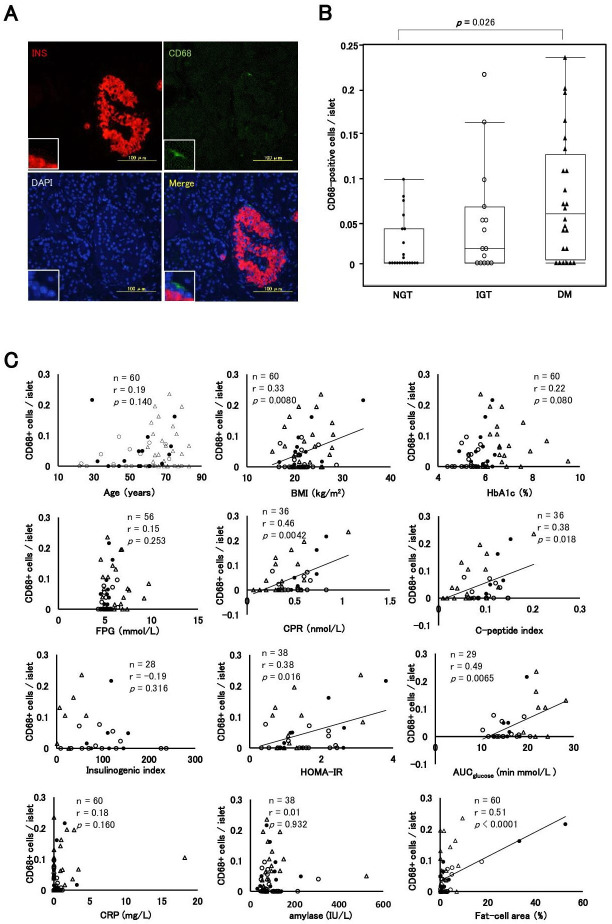
Figure 2.
Intraislet and peripheral islet macrophages. (A) Immunofluorescence staining for insulin (INS) (red), CD68 (green) and 4′,6-diamidino-2-phenylindole (DAPI) (blue) in a patient with NGT. (B) Comparisons of the CD68+ cells per islet among the NGT, IGT, and DM groups. (C) Correlation coefficient between CD68+ cells per islet and parameters of age, BMI, HbA1c, FPG, CPR, C-peptide index, insulinogenic index, HOMA-IR, AUCglucose, CRP, amylase and fat-cell area. Closed circles (●), the NGT group; open circles (○), the IGT group; closed triangles (▲), the DM group. AUCglucose, area under the glucose concentration curve; BMI, body mass index; CPR, C-peptide immunoreactivity; CRP, C reactive protein; DM, diabetes mellitus; FPG, fasting plasma glucose; HbA1c, glycated hemoglobin; HOMA-IR, homeostasis model assessment insulin resistance; IGT, impaired glucose tolerance; NGT, normal glucose tolerance.

