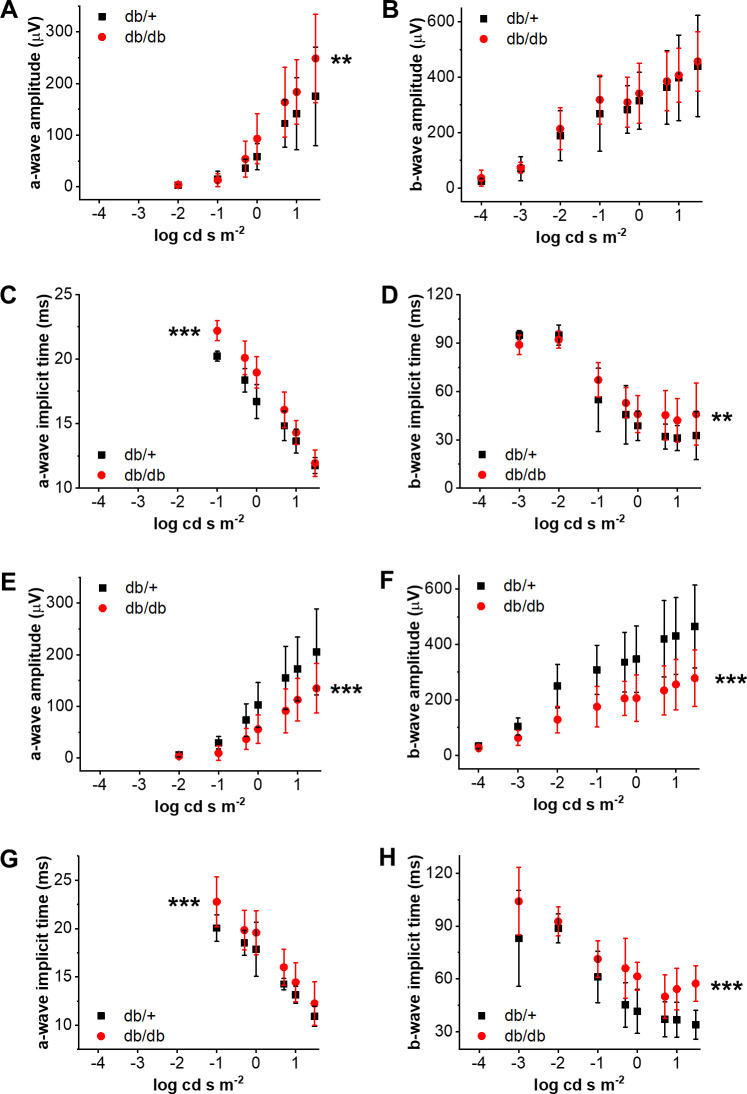
Figure 2.
Scotopic a-waves and b-waves are reduced in 6-month-old but not 3-month-old type 2 diabetic mice in vivo. The scotopic a-wave (A, E) and b-wave (B, F) amplitudes as a function of flash energy (QV) for db/+ (black squares) and db/db (red circles) mice at 3 (A–B, n=4–8 eyes from 2 to 4 animals, **p<0.01) and 6 (E–F, n=9–10 eyes from 5 animals, ***p<0.001) months of age. a-wave and b-wave implicit times in db/db (black squares) mice compared with db/+ (red circles) mice at either time point (C–D and G–H, **p<0.01, ***p<0.001).

