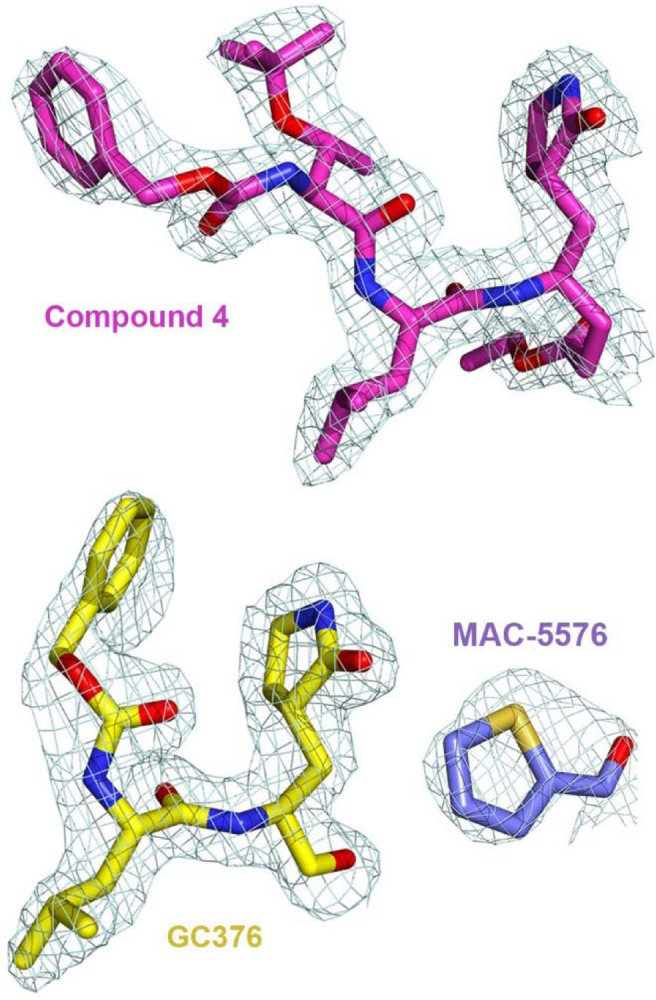
Extended Data Fig. 4. 2Fo–Fc electron density map at 1σ for the inhibitors in the crystal structures.

Electron density mesh (light cyan) for compound 4, GC376, and MAC-5576 in complex with 3CL.

Electron density mesh (light cyan) for compound 4, GC376, and MAC-5576 in complex with 3CL.