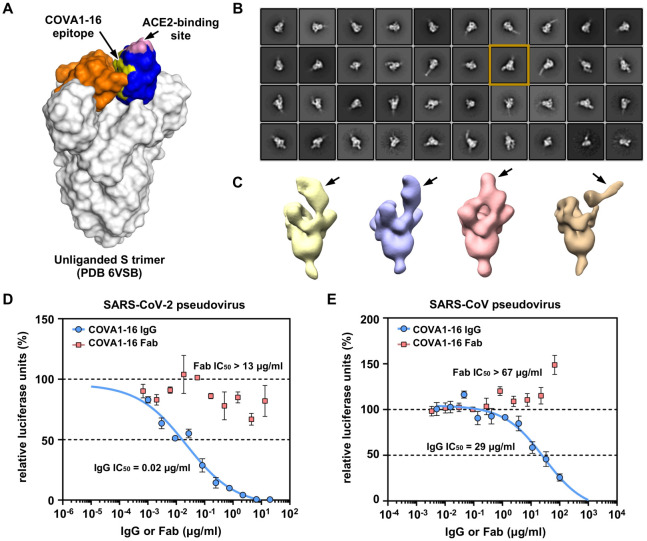
Figure 2. Negative-stain electron microscopy analysis and IgG avidity effect of COVA1–16.
(A) The COVA1–16 epitope on the unliganded SARS-CoV-2 S trimer with one RBD in the “up” conformation (blue) and two in the “down” conformation (orange) (PDB 6VSB) [27]. COVA1–16 epitope is in yellow and ACE2-binding site in pink. (B) Representative 2D class averages from negative-stain EM analysis of SARS-CoV-2 S trimer complexed with COVA1–16 Fab. The 2D class corresponding to the most outward conformation of COVA-16 Fab in complex with S trimer is highlighted in a mustard box. (C) Various conformations of COVA1–16 Fab in complex with the S trimer is revealed by 3D reconstructions. The location of COVA1–16 Fab is indicated by an arrow. (D-E) Neutralization activities of COVA1–16 IgG (blue) and Fab (red) against (D) SARS-CoV-2 and (E) SARS-CoV are measured in a luciferase-based pseudovirus assay. The half maximal inhibitory concentrations (IC50s) for IgG and Fab are indicated in parenthesis. Of note, neutralization for the IgG (IC50 = 0.08 μg/mL) against SARS-CoV-2 pseudovirus infecting 293T/ACE2 cells is comparable to that measured in Huh7 cells (IC50 = 0.13 μg/mL) as reported previously [6].

