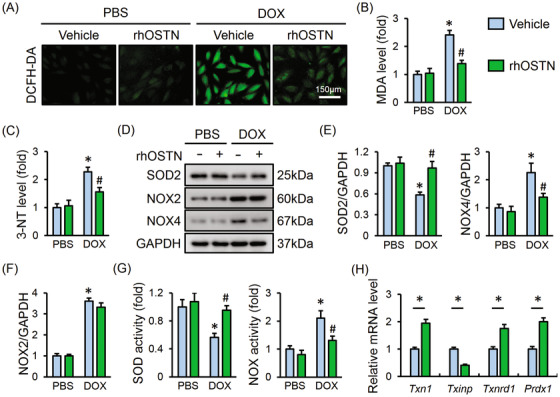
FIGURE 2.

OSTN attenuates DOX‐induced oxidative stress in vitro. A, Representative images of DCFH‐DA staining in H9C2 cells treated with rhOSTN in the presence or absence of DOX (n = 6). B and C, The level of MDA and 3‐NT in H9C2 cells (n = 8). D‐F, Representative western blot images and the corresponding statistical results (n = 6). G, Total SOD activity and NOX activity in H9C2 cells (n = 8). H, The mRNA level of Txn1, Txinp, Txnrd1, and Prdx1 in DOX‐treated H9C2 cells with or without rhOSTN protection (n = 6). Values represent the mean ± SD. * P < .05 versus PBS + Vehicle; # P < .05 versus DOX + Vehicle. In Figure 2H, * P < .05 versus the matched group
