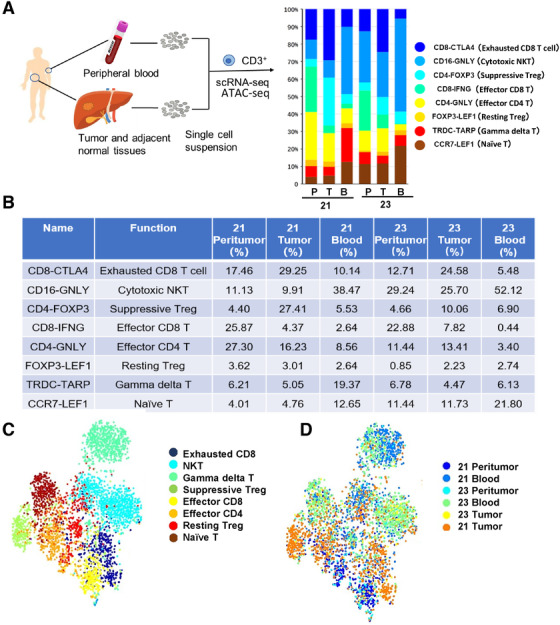
FIGURE 2.

Single CD3+ cell transcriptome analysis. (A‐B), Scheme of the overall study design. Single‐cell RNA sequencing was applied to T cells derived from two patients’ (no. 21 and no. 22) peripheral blood (B), tumor (T), and adjacent normal tissues (P). Paired peritumor tissue or peripheral blood were obtained from same patients. The adjacent normal tissues were at least 3 cm from the matched tumor tissues. Histogram showing the average percentage of different types of T cells in different tissues. This table quantified the proportion. (C) T‐SNE visualization of T cells clusters based on 6267 single‐cell transcriptomes. (D) The t‐SNE projection of two patients, showing the formation of cell origin
