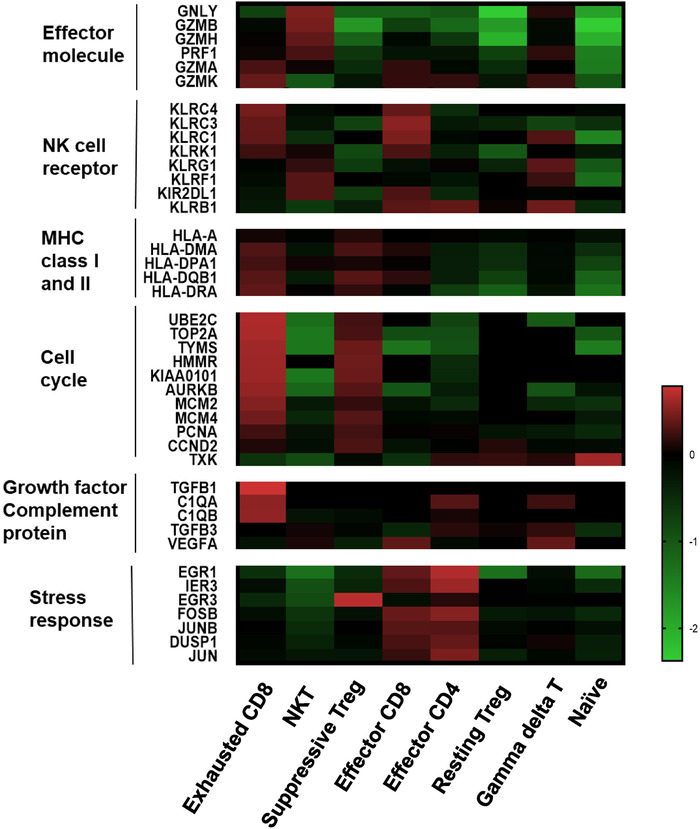
FIGURE 5.

Comparison of key features between clusters. Heat map showing normalized mean expression of selected T cell function‐associated genes from scRNA in each cell cluster. It included critical genes coding effector molecule, NK cell receptor, MHC class I and II, cell cycle growth factor complement protein and stress response
