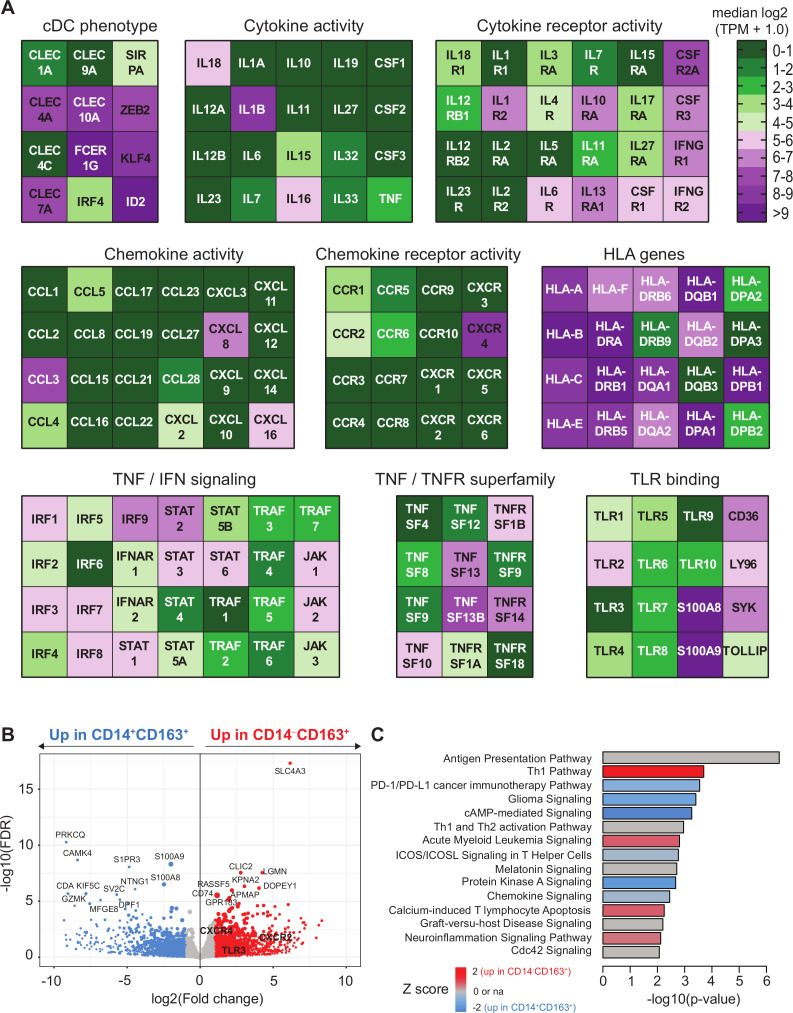
Figure 5.
Transcriptome analysis of CD163+ cDC2 cells. CD5+CD14‒CD163+ DC and CD14+CD163+ were isolated by flow activated cell sorter (FACS) sorting and analyzed by bulk RNA sequencing as described.14 (A) Heatmaps displaying median log2-transformed TPM + 1.0 expression values of genes associated with CDC phenotype, HLA, TNF/TNFR superfamily, cytokine and chemokine (receptor) activity, toll-like receptor (TLR) binding and TNF and IFN signaling within CD163+ cDC2 cells. (B) Volcano plot showing differential gene expression between CD14+CD163+ and CD14‒CD163+ cells. Gene expression data are depicted as log2(Fold change) versus –log10(false discovery rate (FDR)). P values were calculated using DESeq2. (C) Ingenuity pathway analysis of differentially regulated genes (<0.05 FDR) between CD14+CD163+ and CD14‒CD163+ cells displayed as a histogram plot showing the −log10 (p value) and the Z score for each pathway using twofold upregulated and downregulated DEGs of each subset. cDC2, conventional dendritic cell type 2; DEGs, differentially expressed genes; TPM, transcript per million.

