Figure 6.
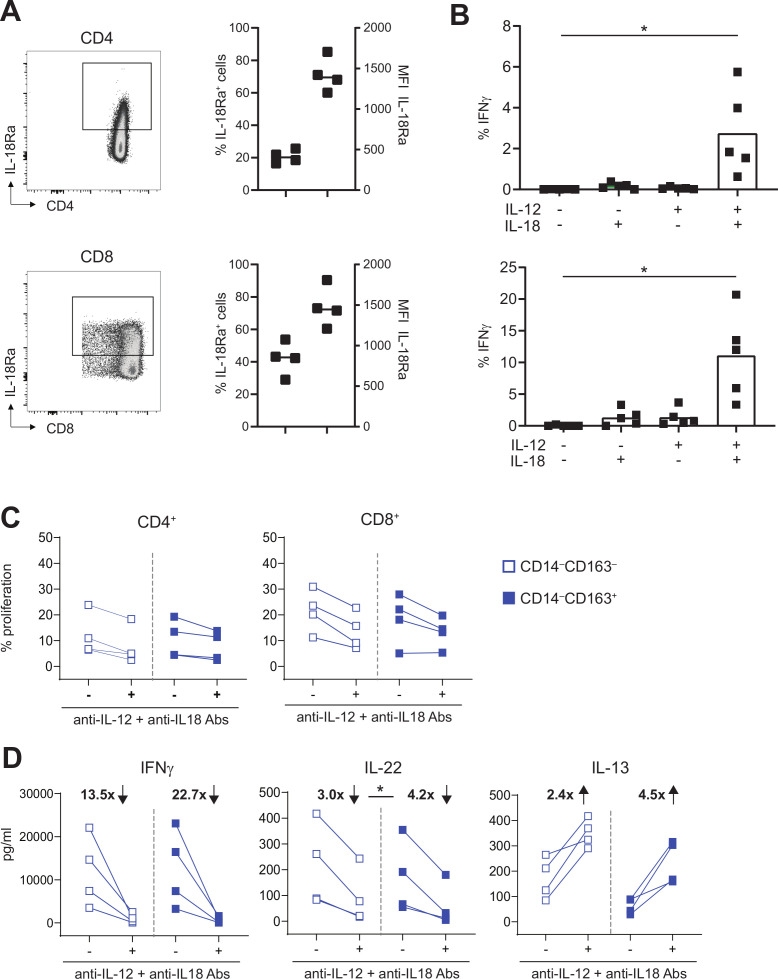
IL-12 and IL-18 are instrumental for IFNγ and IL-22 production by activated T cells. (A) IL-18Ra expression is depicted for CD4+ (top) and CD8+ T cells (bottom) for a representative healthy-donor PBMC sample (left) and four samples (right). scatter plots show percentage of IL-18RA+ cells (left Y-axis) and MFI of the IL-18RA+ cells (right Y-axis). (B) Graph showing percentage of IFNγ+ cells within CD4+CD45RO+ (top) and CD8+CD45RO+ (bottom) T cells after culture for 24 hours in the presence or absence of 50 ng/mL IL-12 and/or IL-18 (n=5). (C–D) To test the effect of blocking IL-12 and IL-18, proliferation and cytokine production of CD4+ and CD8+ CD45RO+ T cells or total PBMCs was assessed after stimulation for 4 days with CD14‒CD163‒ DC (open blue) and CD14‒CD163+ DC (closed blue) in the presence or absence of 10 µg/mL anti-IL-12 and anti-IL-18 antibodies. Graphs depict (C) the percentage proliferation of CD4+CD45RO+ (left) and CD8+CD45RO+ (right) T cells, and (D) the IFNγ (left), IL-22 (middle) and IL-13 (right) production in pg/mL by total PBMCs in the presence or absence of IL-12 and IL-18 blocking antibodies (n=4). The fold change in IFNγ, IL-22 and IL-13 production, which was calculated by dividing the mean cytokine concentration in the absence of blocking antibodies by the mean cytokine concentration in the presence of blocking antibodies, is depicted in bold as increased (↑) or decreased (↓) on blockade. *p<0.05, **p<0.01, ***p<0.001 and ****p<0.0001. DC, dendritic cell; MFI, mean fluorescence intensity; PBMCs, peripheral blood mononuclear cells.

