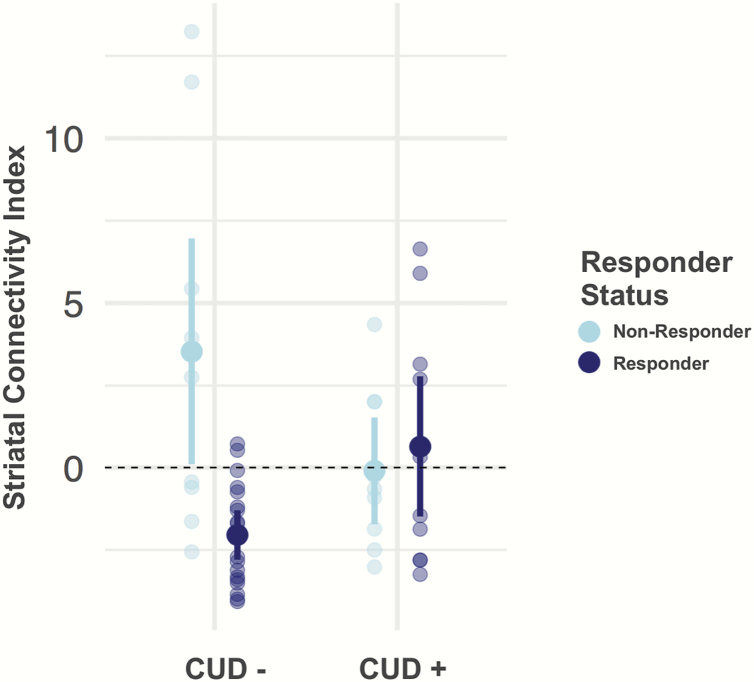
Fig. 1.
This graph shows the interaction of the striatal connectivity index (SCI) and cannabis use disorder in distinguishing responders from nonresponders to treatment. In patients without a history of cannabis use disorder (CUD) (CUD− = 28), baseline SCI distinguished between responders and nonresponders, results that are consistent with our prior work.34 In patients with a history of CUD (CUD+ = 20), the SCI no longer separated responders from nonresponders. The displayed values represent the mean SCI for each group. Error bars represent 95% confidence intervals and individual values are overlaid. Treatment response was defined based on stringent clinical criterion described in the Methods section.

