. 2020 Jun 10;1(1):96–111. doi: 10.1158/0008-5472.BCD-19-0041

Figure 1.

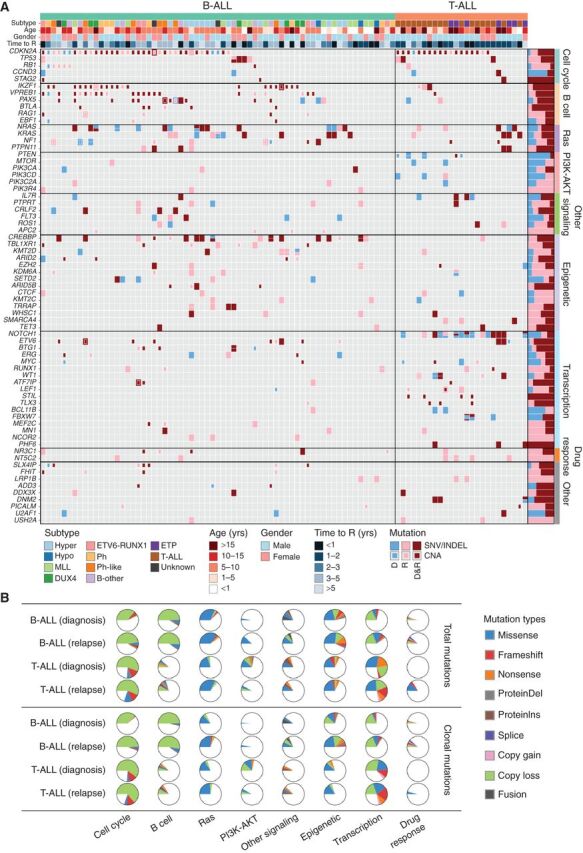
Figure 1. Somatic mutation spectrum in ALL at diagnosis and relapse. A, Nonsilent mutations in recurrently affected (≥3 cases) key genes (COSMIC Cancer Gene Census or reported leukemia relevant genes) in diagnosis (D) and first available relapse (R) sample per case. The B-ALL cases are grouped into well-defined disease subtypes, which include hyperdiploid (Hyper), hypodiploid (Hypo), KMT2A (MLL)-rearranged, DUX4-rearranged (DUX4), ETV6-RUNX1, BCR-ABL1 (Ph), Ph-like, and a group of other B-ALL subtypes including B-other, PAX5 P80R, and iAMP21 ALL. Mutations in the form of SNV/indels and focal CNAs are shown as rectangles with different sizes. Mutations observed only in D, only in R or shared by D and R are shown in blue, pink, and dark red colors, respectively. The prevalence for each gene mutation is shown in bar graph on the right. B, Distribution of recurrent mutations in key pathways. Top, all recurrent mutations; bottom, the clonal (MAF ≥ 30%) nonsilent mutations. Samples are divided into B-ALL (n = 67) and T-ALL (n = 25) and the mutation ratio in diagnosis and relapse stages is shown. Detailed mutation types are indicated by different colors.

Somatic mutation spectrum in ALL at diagnosis and relapse. A, Nonsilent mutations in recurrently affected (≥3 cases) key genes (COSMIC Cancer Gene Census or reported leukemia relevant genes) in diagnosis (D) and first available relapse (R) sample per case. The B-ALL cases are grouped into well-defined disease subtypes, which include hyperdiploid (Hyper), hypodiploid (Hypo), KMT2A (MLL)-rearranged, DUX4-rearranged (DUX4), ETV6-RUNX1, BCR-ABL1 (Ph), Ph-like, and a group of other B-ALL subtypes including B-other, PAX5 P80R, and iAMP21 ALL. Mutations in the form of SNV/indels and focal CNAs are shown as rectangles with different sizes. Mutations observed only in D, only in R or shared by D and R are shown in blue, pink, and dark red colors, respectively. The prevalence for each gene mutation is shown in bar graph on the right. B, Distribution of recurrent mutations in key pathways. Top, all recurrent mutations; bottom, the clonal (MAF ≥ 30%) nonsilent mutations. Samples are divided into B-ALL (n = 67) and T-ALL (n = 25) and the mutation ratio in diagnosis and relapse stages is shown. Detailed mutation types are indicated by different colors.